89
98-05273-EN R7
MATRIX
®
Pro 570GS
•
MATRIX
®
Pro840GS
HOMESETUPGUIDANCE FULL SCREENIMPLEMENT INTRODUCTIONGNSSAPPENDIX RATE CONTROL
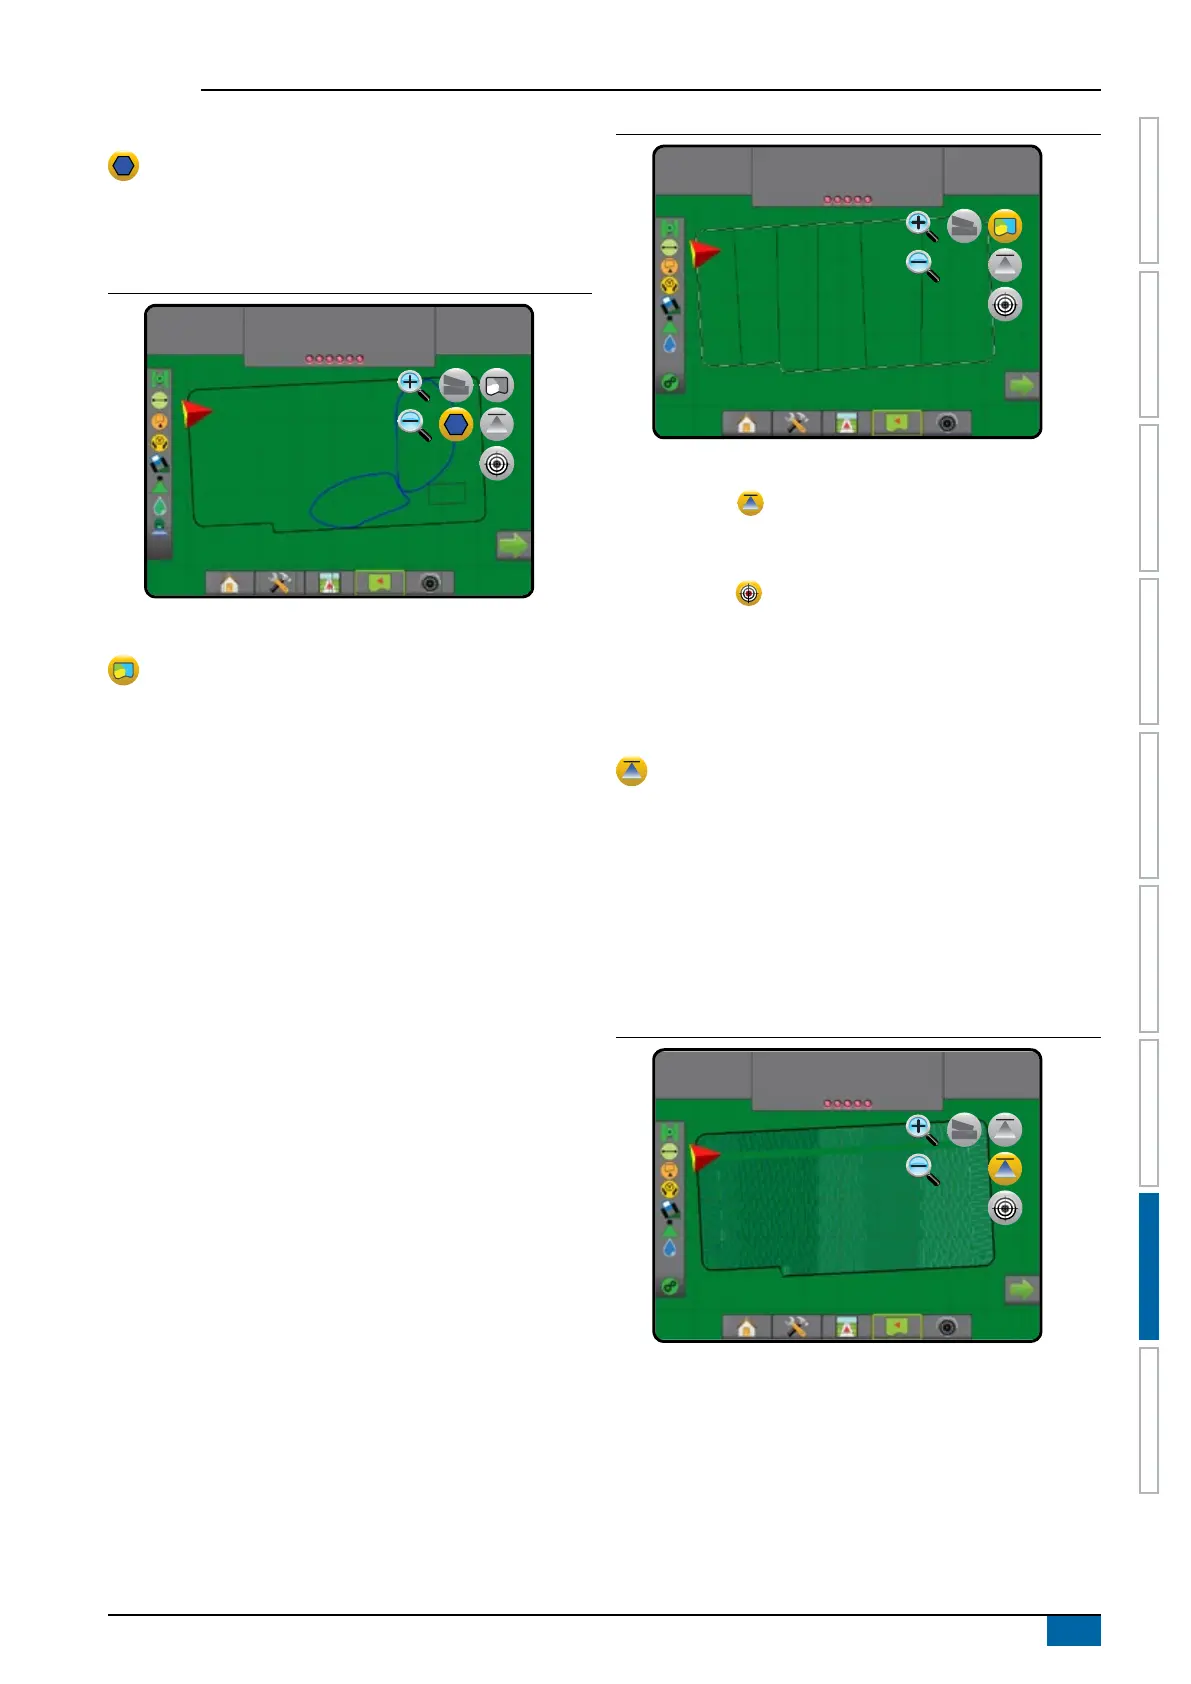
Polygons map
Polygon map shows all mapped polygons.
On screen mapping
• Guidelines
◄Blue – polygon boundary line
Figure 8-8: Polygon map with Rate control available
27.00
ac
10.0
mph
Mark A
Prescription map
Prescription map is a pre-loaded map that provides
information to the rate controller for use in applying product.
Prescription maps contain geo-referenced product rate information.
The Matrix Pro GS can import job data containing Prescription maps
for use with variable-rate application (VRA) using compatible rate
controllers.
On screen mapping
• Zone lines:
◄Black when approaching the application zone.
◄White when within the application zone.
◄ Other zones having the same rate will also be shown in
white.
• Coverage area – illustrates different prescription rate zones:
◄ User selected – zone colours are selected when
establishing the Prescription map.
With Fieldware Link (v5.01 or later), users can import VRA jobs
created in Fieldware Link, as well as export job data from the
console, edit the included maps to create Target rate or Prescription
maps, and transfer back to the console for job use.
NOTE: Advanced job mode is required for variable rate
applications. See Options (Job mode) in the System setup
chapter.
Figure 8-9: Prescription map
27.00
ha
10.0
km/h
Mark A
Application and target rate maps
Application map shows how much product has been applied
and where, using colour to indicate level in proportion to preset or
automatically set maximum and minimum levels
Target rate map shows the application rate that the rate
controller attempted to achieve at each location
NOTE: Application map and Target Rate map cannot be selected
simultaneously.
Application map
Application map shows how much product has been applied
and where, using colour to indicate level in proportion to
preset or automatically set maximum and minimum levels.
NOTE: Application map and Target rate map cannot be selected
simultaneously.
On screen mapping
• Coverage area – illustrates applied area:
◄ User selected – applied areas show coloured bars relative
to selected colour range and map selection.
Figure 8-10: Application map
27.00
ha
10.0
km/h
Mark A