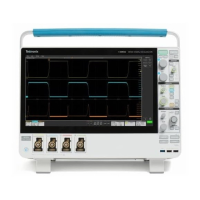
Cursor configuration menu
Cursors are on-screen lines (bars) that you position in a W
aveform or Plot views to take manual measurements on signals. They appear as
horizontal and/or as vertical lines.
To open the Cursors configuration menu:
1. Double-tap a cursor readout or cursor line, or
2. Touch and hold a cursor readout or cursor line and select Configure Cursors from the right-click menu.
To display cursors on the screen, tap the Cursors button on the display.
Cursor configuration menu fields and controls
Some fields or controls are available only when certain other controls are selected.
Field or control Description
Display Tap to toggle the cursor display On or Off.
Readout Location Tap to set where to display cursor readouts.
Graticule displays the cursor readouts on the screen cursor bars (default method). Y
ou can move the
readouts on cursors by touching and dragging them along the cursor bar.
Badge removes the screen cursor readouts and displays the cursor information in a Cursors badge in
the Results bar. The Cursors badge content changes as you change the cursor type.
Cursor Type Tap to select the cursor type from the drop-down list.
Waveform cursors measure vertical amplitude and horizontal time parameters simultaneously at the
point the cursor intersects a waveform. The cursor intersect point tracks waveform amplitude changes.
V Bars are vertical cursors that measure horizontal parameters (typically time). They are not
associated with the waveform, but show the time position of the cursor in the waveform record.
H Bars are horizontal cursors that measure amplitude (typically in volts or amperes). They are not
associated with the waveform, but show the amplitude position of the cursor.
V&H Bars cursors measure vertical and horizontal parameters simultaneously. They are not
associated with the waveform, but show the time and amplitude position of the cursors.
Source Waveform Tap to select the source waveform (the waveform on which to display the cursors).
Same places both cursors on the same waveform.
Split allows each cursor to be on a different waveform.
Available when Cursor Type is Waveform.
If Source is set to All then the Source Waveform is unavailable.
Readout Type Tap to select the type of readout to display for a XY plot. This control is only available when the Cursor
Type is set to Waveform or V&H Bars.
Rectangular displays the position values and the difference (delta) between cursors.
Polar displays the polar information for each cursor. The top value is the magnitude of the vector
drawn from the origin of the plot to the location of the cursor. The bottom value is the angle of the
vector drawn from the origin of the plot to the location of the cursor.
Table continued…
Menus and dialog boxes
2 Series MSO MSO24 and MSO22 165
 Loading...
