3.7 Operation Procedure (Audio Analyzer)
67
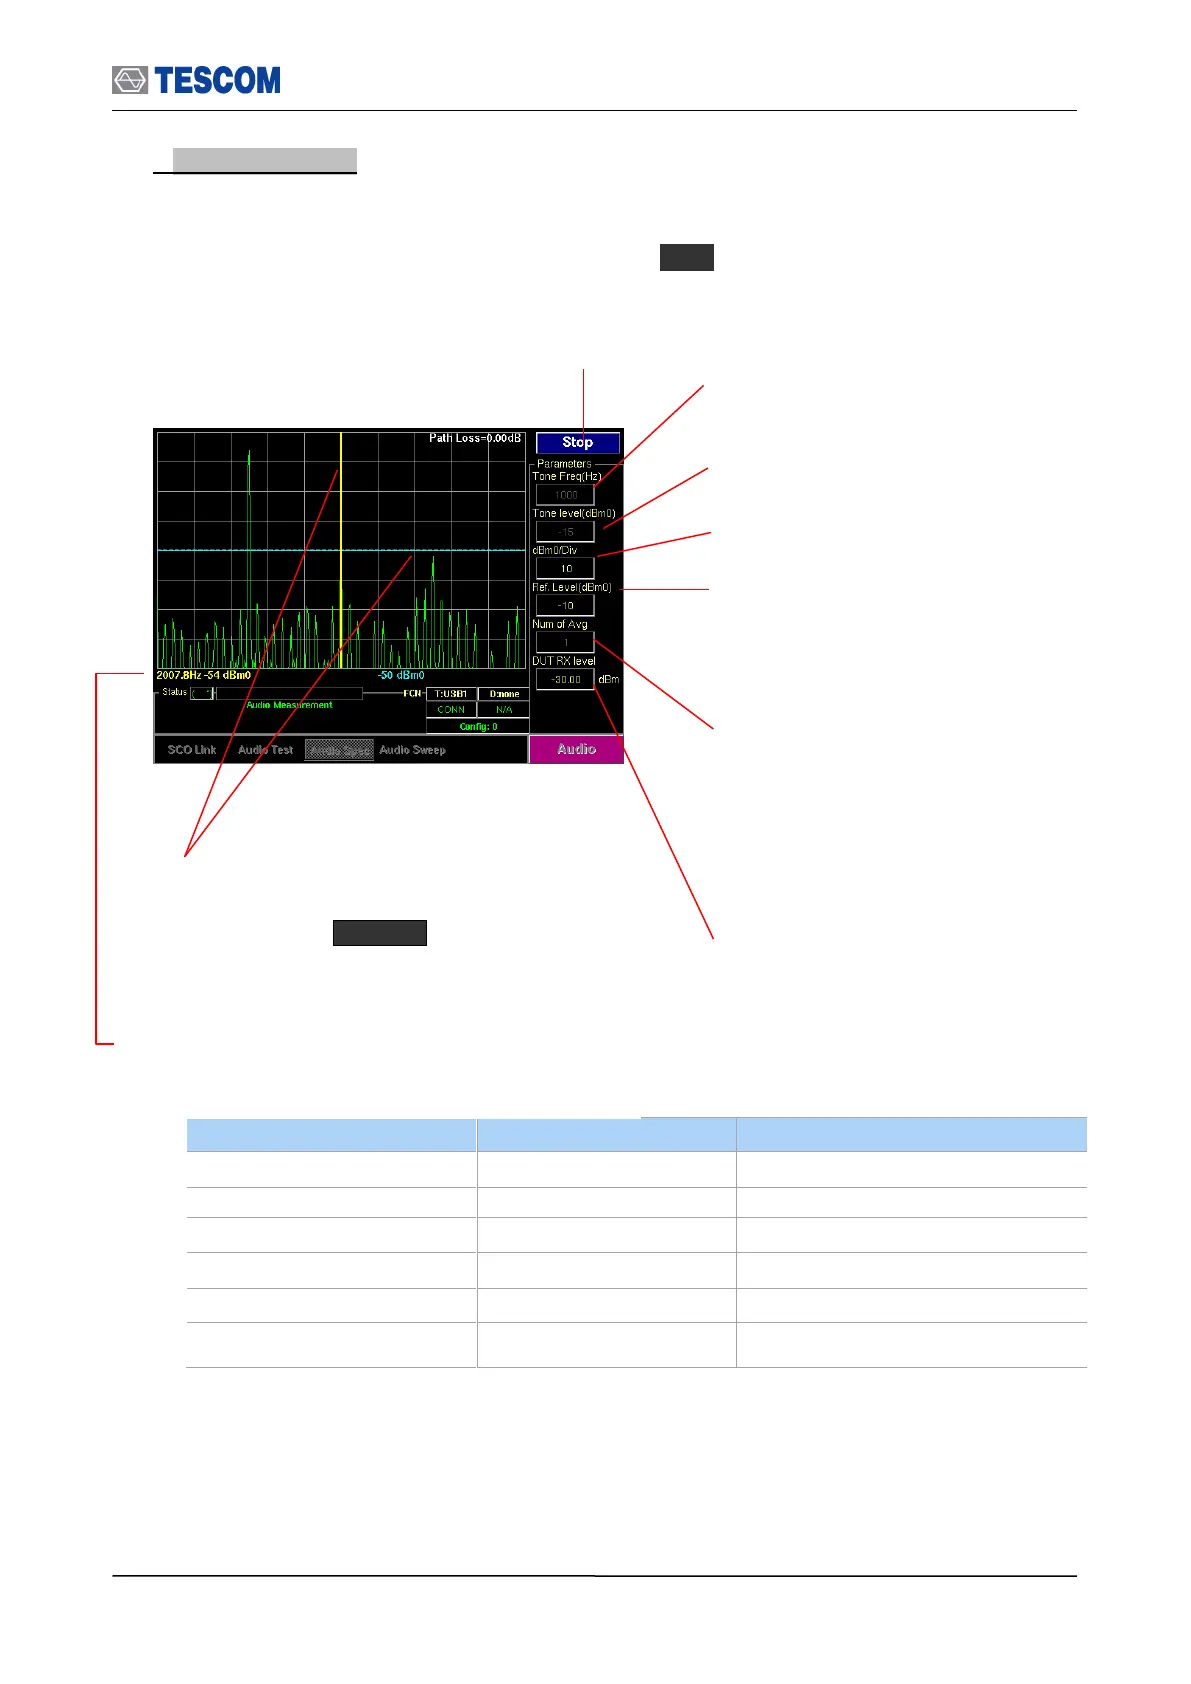
2. Audio Spectrum: TC-3000C has the ability to analyze the frequency spectrum of an
audio signal. You can measure frequency, amplitude, and harmonics of the audio signal in
this screen. The frequency range of spectrum is from 0 Hz to 4 kHz (sampling frequency =
8 kHz). To access Audio spectrum screen, press M3 soft key.
Line Markers: You can place line-shaped markers on the
screen to find the signal’s frequency and time. To activate
a maker, press the Marker key in sequence. An
activated marker changes to a solid line. Turn the knob to
place the marker at the signal.
Readouts of markers Frequency and Level: The
marker readouts have the same color as the marker
respectively.
Start/Stop: When this menu is pressed the tests will run
once. When pressed again while the tests are running, the
testing will stop.
Ref. Level: Specifies the amplitude reference
level. The top line of the display is the
reference level. All signals displayed are
reference to this line.
dBm0/div: Sets the vertical amplitude per
division.
Tone level (dBm0): Specifies the power
of the TX audio signal.
DUT RX level: Specifies the DUT RX level.
TC-3000C controls the TX level in
consideration of the Path Loss so that the
DUT can receive the level specified
Tone Freq (Hz): Defines the tone frequency
for the test.
Number of Average: Measurement Averaging.
The signal averaging improves the signal to noise
ratio. The noise, i.e., the measurement error,
decreases by 1/SQRT(N) for N averages, but the
measurement time increases by N times.
Increasing averaging will reduce the measurement
fluctuation.