First Steps with the Fluorescence Detector 2
1100 Series FD Reference Manual 39
Stray light acts in the same way as impurities in that it simulates background
noise. In both cases, a higher noise level and therefore a higher limit of
detection are obtained. This indicates that high sensitivity measurements
should be done away from wavelength settings that have a high stray light
background.
Step 2: Optimize limits of detection and selectivity
To achieve optimum limits of detection and selectivity, analysts must find out
about the fluorescent properties of the compounds of interest. Excitation and
emission wavelengths can be selected for optimum limits of detection and best
selectivity. In general, fluorescence spectra obtained with different
instruments may show significant differences depending on the hardware and
software used.
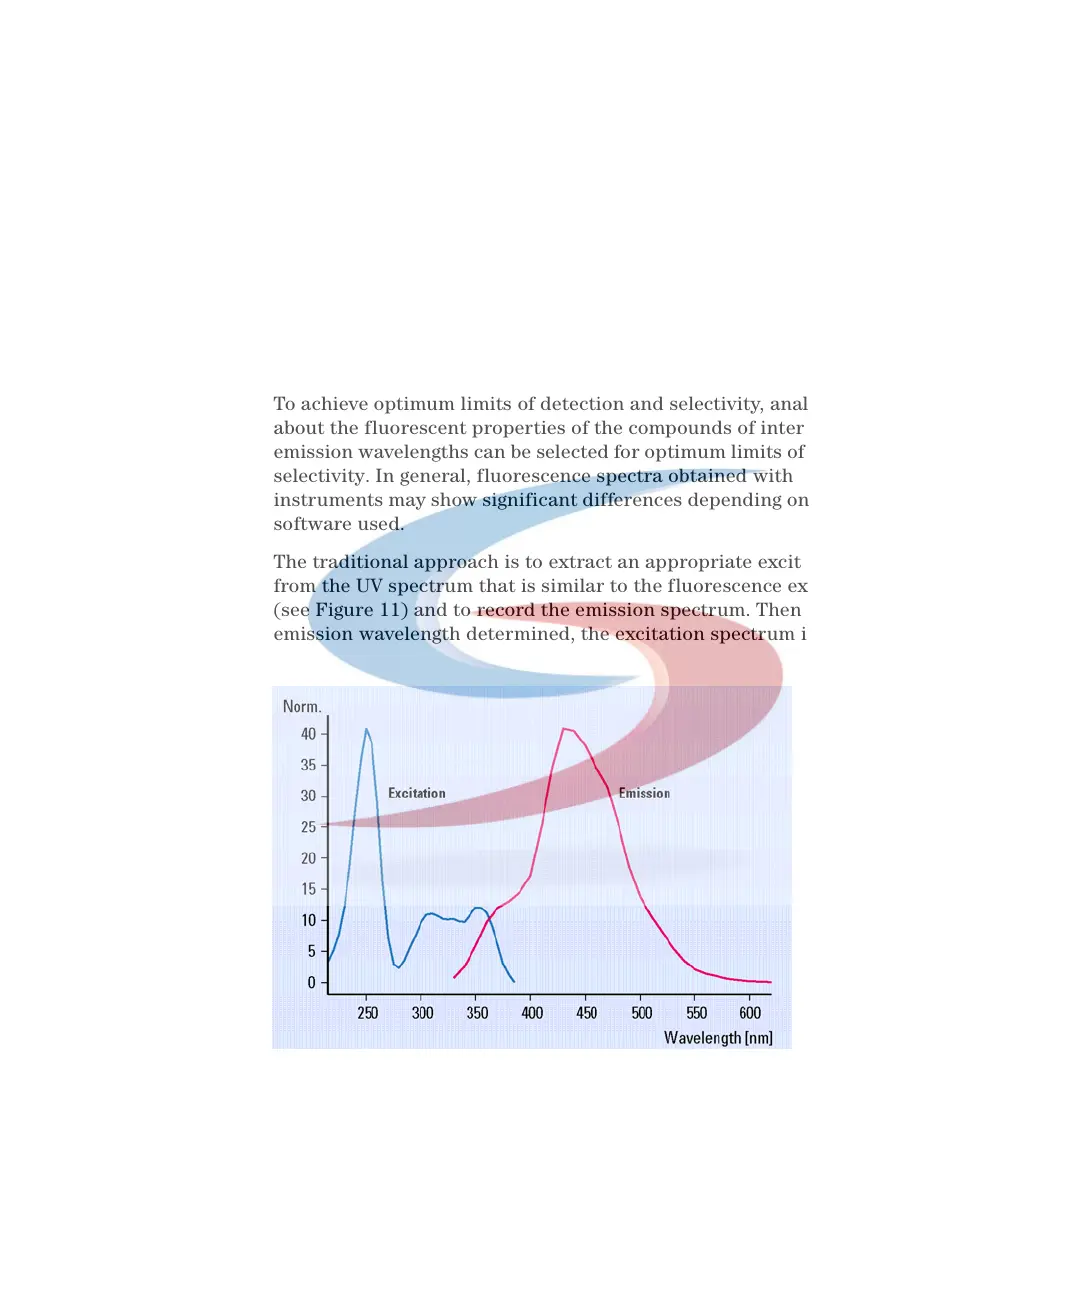
The traditional approach is to extract an appropriate excitation wavelength
from the UV spectrum that is similar to the fluorescence excitation spectrum
(see Figure 11) and to record the emission spectrum. Then with an optimum
emission wavelength determined, the excitation spectrum is acquired.
Figure 11 Excitation and emission spectra of quinidine
Excitation spectrum
with emission at
440 nm, emission
spectrum with
excitation at 250 nm
of 1 ug/ml quinidine.
Detector settings:
step size 5 nm, PMT
12, Response time 4 s.
 Loading...