EasyManua.ls Logo

Agilent Technologies 1100 Series - Observe the Maxima Via the Isoabsorbance Plot

Agilent Technologies 1100 Series
346 pages
To Next Page IconTo Next Page
To Previous Page IconTo Previous Page
Loading...
36 1100 Series FD Reference Manual
2 First Steps with the Fluorescence Detector
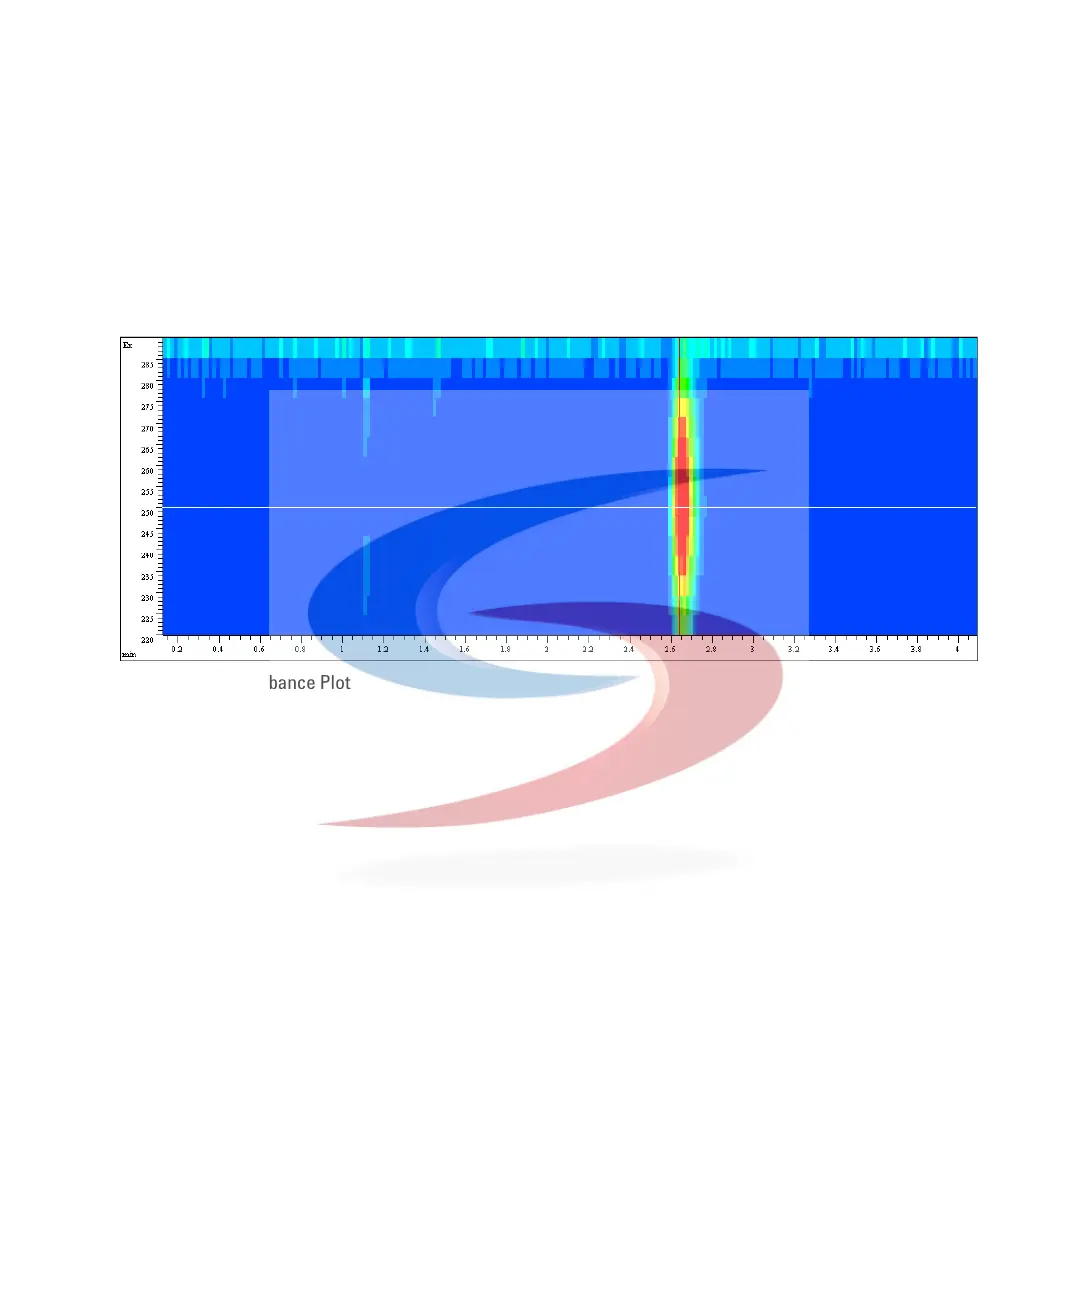
Observe the maxima via the isoabsorbance plot
1 Load the data file (λ
EX
=246 nm, λ
EM
=317 nm) and open the isoabsorbance
plot.
2 The maximum
λ
EX
will be found around 250 nm.
Figure 9 Isoabsorbance Plot

Table of Contents

Other manuals for Agilent Technologies 1100 Series

Related product manuals