S331L UG PN: 10580-00321 Rev. M 3-53
Cable and Antenna Measurements 3-10 Measurement Menu
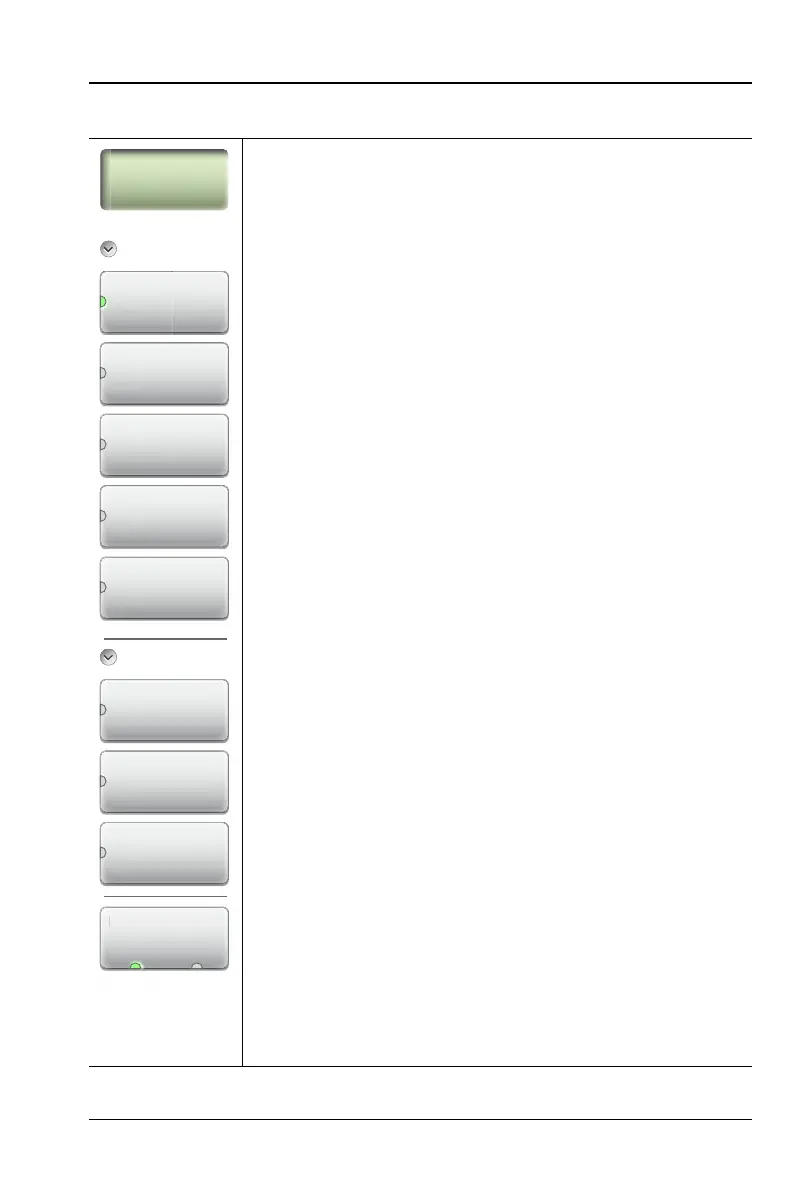
Measurement Menu (Continued)
Advanced:
Smith Chart: Press this submenu key to view the
measurement results in a Smith Chart. The Smith Chart
is a graphical tool that is used to plot the impedance of
the device connected to the Site Master. It converts the
measured reflection coefficient data into impedance data
and displays it in a manner that makes the Smith Chart a
useful tool for determining and tuning input match. This
complex impedance plot reveals which matching
elements are necessary to match a device under test to
the reference impedance (which can be set in the
Amplitude menu to either 50 Ω or 75 Ω).
1-Port Phase: Press this submenu key to display the
phase of the reflection measurement of the device
connected to the RF Out/Reflect In port. The Phase
display range is from –450 degrees to +450 degrees.
The 1-port phase measurement is most useful when
making relative measurements (comparing the phase of
one device to the phase of another) by utilizing the Trace
Math function (Trace – Memory).
Transmission (Ext. Sensor): Press this submenu key
to measure through the DUT. The Transmission
measurement between the RF Out/Reflect In port and an
External USB Sensor is used to measure the loss (or
gain) in dB of a device. This measurement requires that
one port of the device be connected directly (or through a
test port cable) to the RF Out/Reflect In port of the Site
Master. The second port of the device connects to the
External USB Sensor.
Common:
Display Format
Single Dual: Press this submenu key to toggle the
sweep window to show one trace (Single) or
two traces (Dual). In dual display format, the active trace
is framed with a red border. You can touch either trace to
make it the active trace.
Figure 3-41. Measurement Menu (2 of 2)
Measurement
Standard
Return Loss
n
t
rn
DTF
Return Loss
Cable Loss
VSWR
DTF VSWR
Advanced
Smith Chart
1-Port Phase
Display Format
Disp
a
Form
Single Dual
Transmission
(Ext. Sensor)