3-24 PN: 10580-00321 Rev. M S331L UG
3-5 Advanced Measurements Cable and Antenna Measurements
3-5 Advanced Measurements
Smith Chart
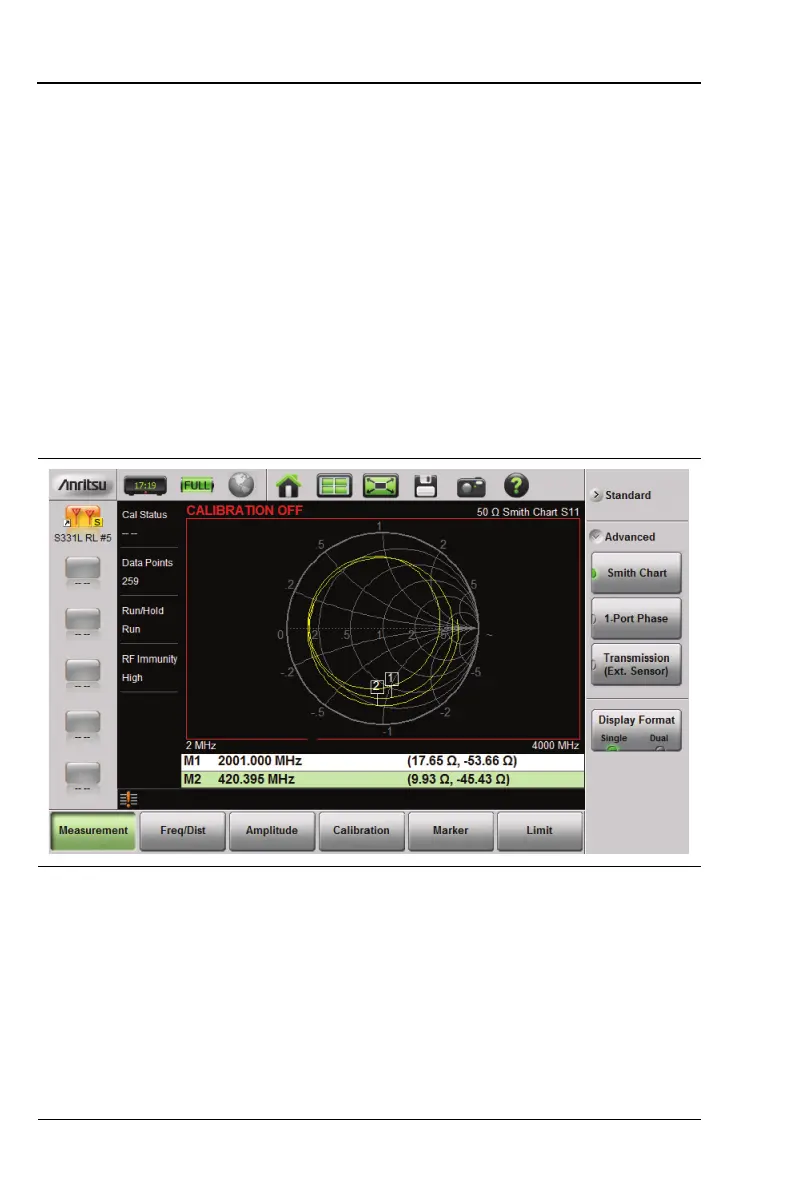
The Smith Chart is a graphical tool for plotting impedance data versus
frequency. It converts the measured reflection coefficient data into
impedance data and displays it in a manner that makes the Smith
Chart a useful tool for determining and tuning input match. Markers
can be used to read the real and imaginary parts of the complex
impedance. See the example in Figure 3-19. This impedance plot reveals
which matching elements (capacitance, inductance) are necessary to
match a device under test to the reference impedance, which can be set
to either 50 ohms or 75 ohms. See Figure 3-20 and refer to “Amplitude
Menu” on page 3-57.
Figure 3-19. Smith Chart Measurement