144 BD FACSAria User’s Guide
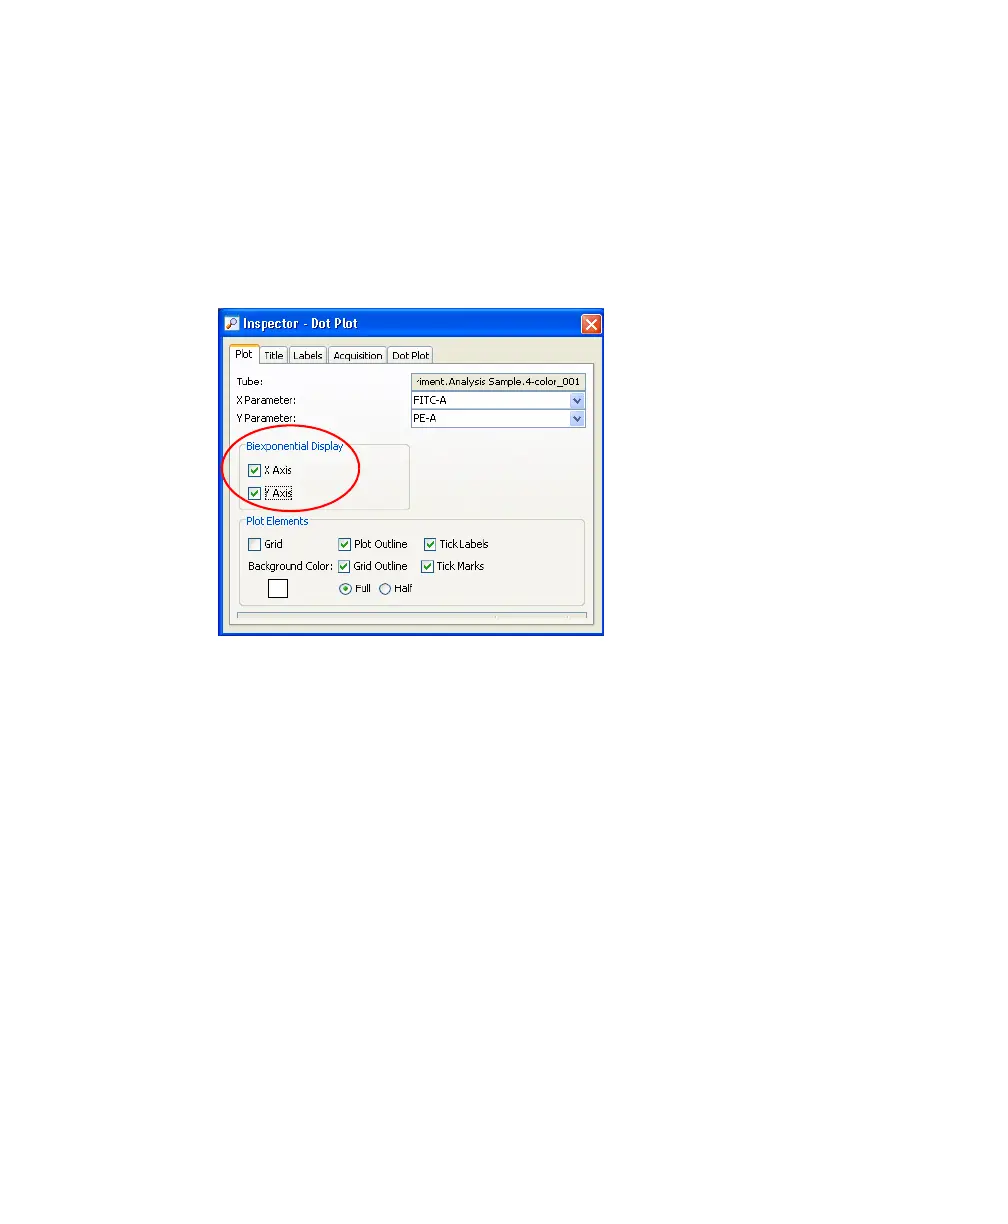
3 Turn on biexponential display.
Select the two plots.
In the Inspector, select the checkboxes for X Axis and Y Axis under
Biexponential Display. See Figure 4-14.
Figure 4-14 Turning on Biexponential Display
4 Set up the fluorescence plots to display data from the FSC gate.
The FSC gate defines singlet events. By gating the fluorescence plots
through this population, only singlet events will be recorded.
• Select the two plots.
• In the Inspector, select the FSC Gate checkbox.
5 Arrange the fluorescent plots so they fill the page vertically.
For an example, see Figure 4-16 on page 148.