146 BD FACSAria User’s Guide
10 Repeat steps 7 to 9 for the remaining tubes.
Analyzing Data
This section describes how to set up plots, gates, and a statistics view to analyze
the recorded data. By the end of this section, your analysis should look similar to
that shown in Figure 4-16 on page 148.
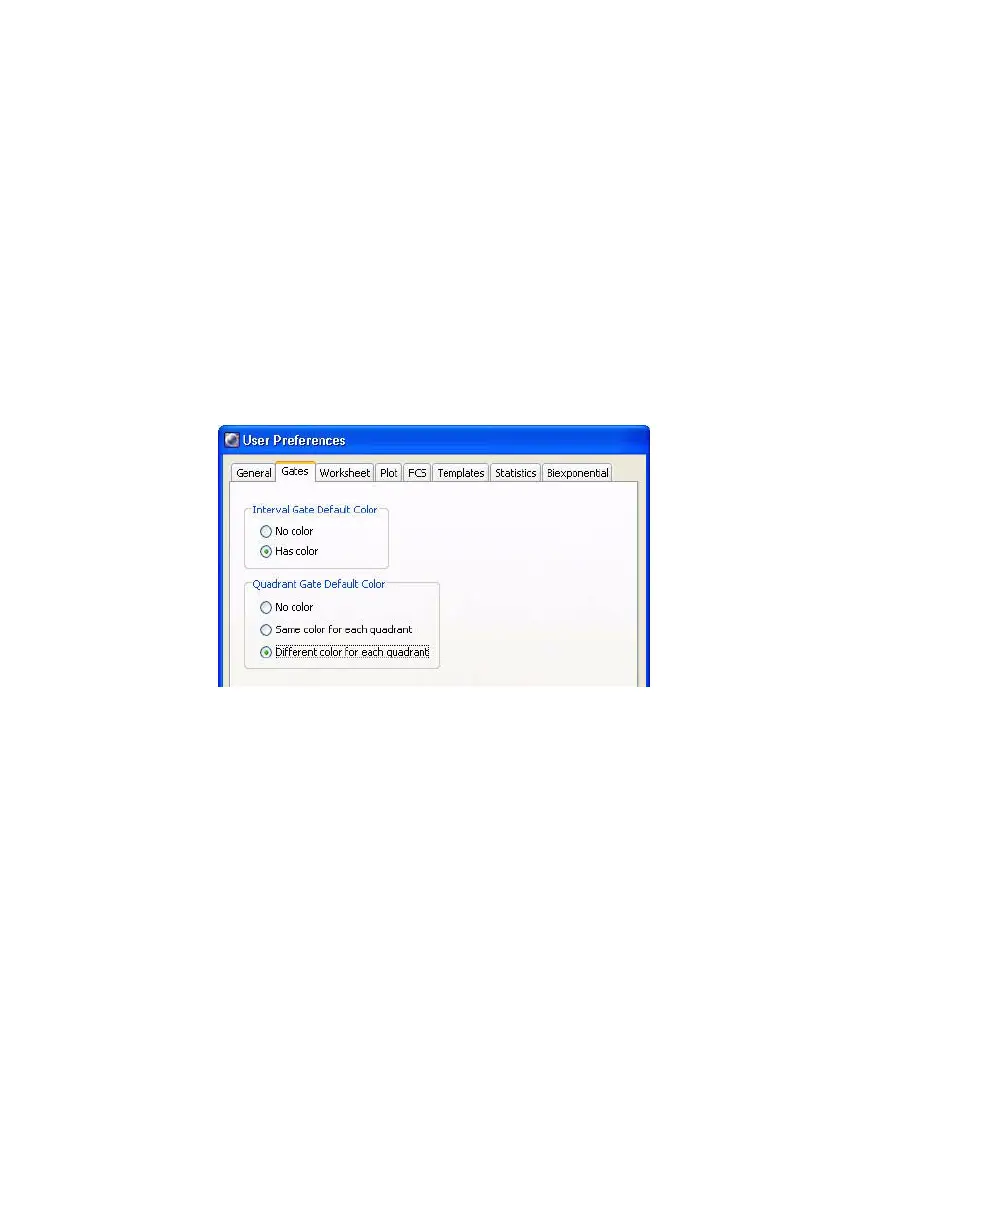
1 Select Edit > User Preferences.
2 On the Gates tab, set the preferences as follows:
3 Create the following gates:
• Create a quadrant gate on the FITC vs PE plot.
• Create an interval gate to capture the APC beads.
• Create a rectangle gate to capture the PerCP-Cy5.5 beads.
4 Rename each population in the population hierarchy.
Tip Press the Enter key twice to move to the next population without
using the mouse.
5 Right-click either fluorescent plot and select Create Statistics View.