CAPINTEC, INC. CAPRAC
®
-t
9-12 TESTS April 2021
Results
To save the measurement results, touch the ACCEPT button. Figure 9-10 System
Test Results Screen will appear.
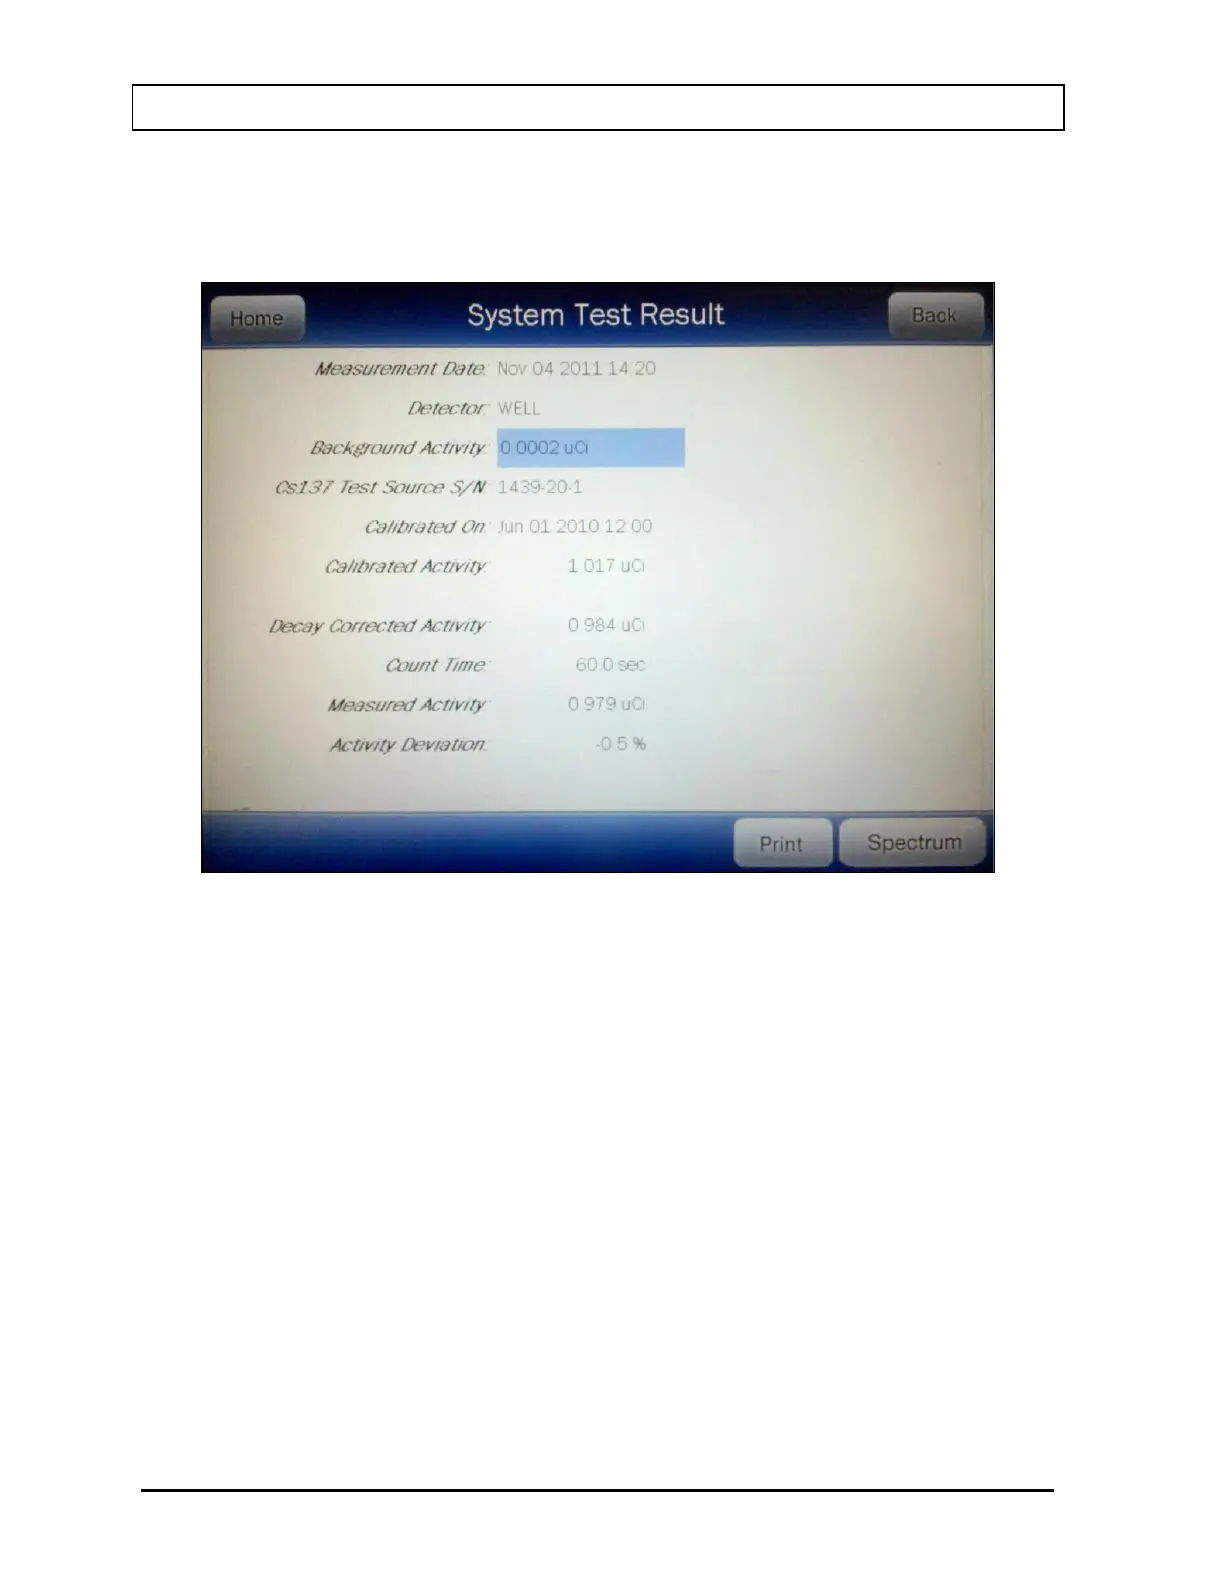
Figure 9-10 System Test Results Screen
The results screen displays the following information:
• The Measurement Date,
• The measured Background activity.
• The entered Cs137 Test Source information.
• Decay Corrected Activity – this is the calculated current activity.
• Count Time – this is the set counting time period.
• Measured Activity – this is the activity that was measured during the System
Test.
• Activity Deviation – deviation of the Measured Activity from the Decay
Corrected Activity. If the deviation is more than ±10%, “FAILED” will appear in
red on the screen next to Activity Deviation result (probably used wrong
source).