CAPINTEC, INC. CAPRAC
®
-t
April 2021 TESTS 9-13
Print Results
If a printer is attached to the system, the test results can be printed by touching the
PRINT button.
View System Test Spectrum
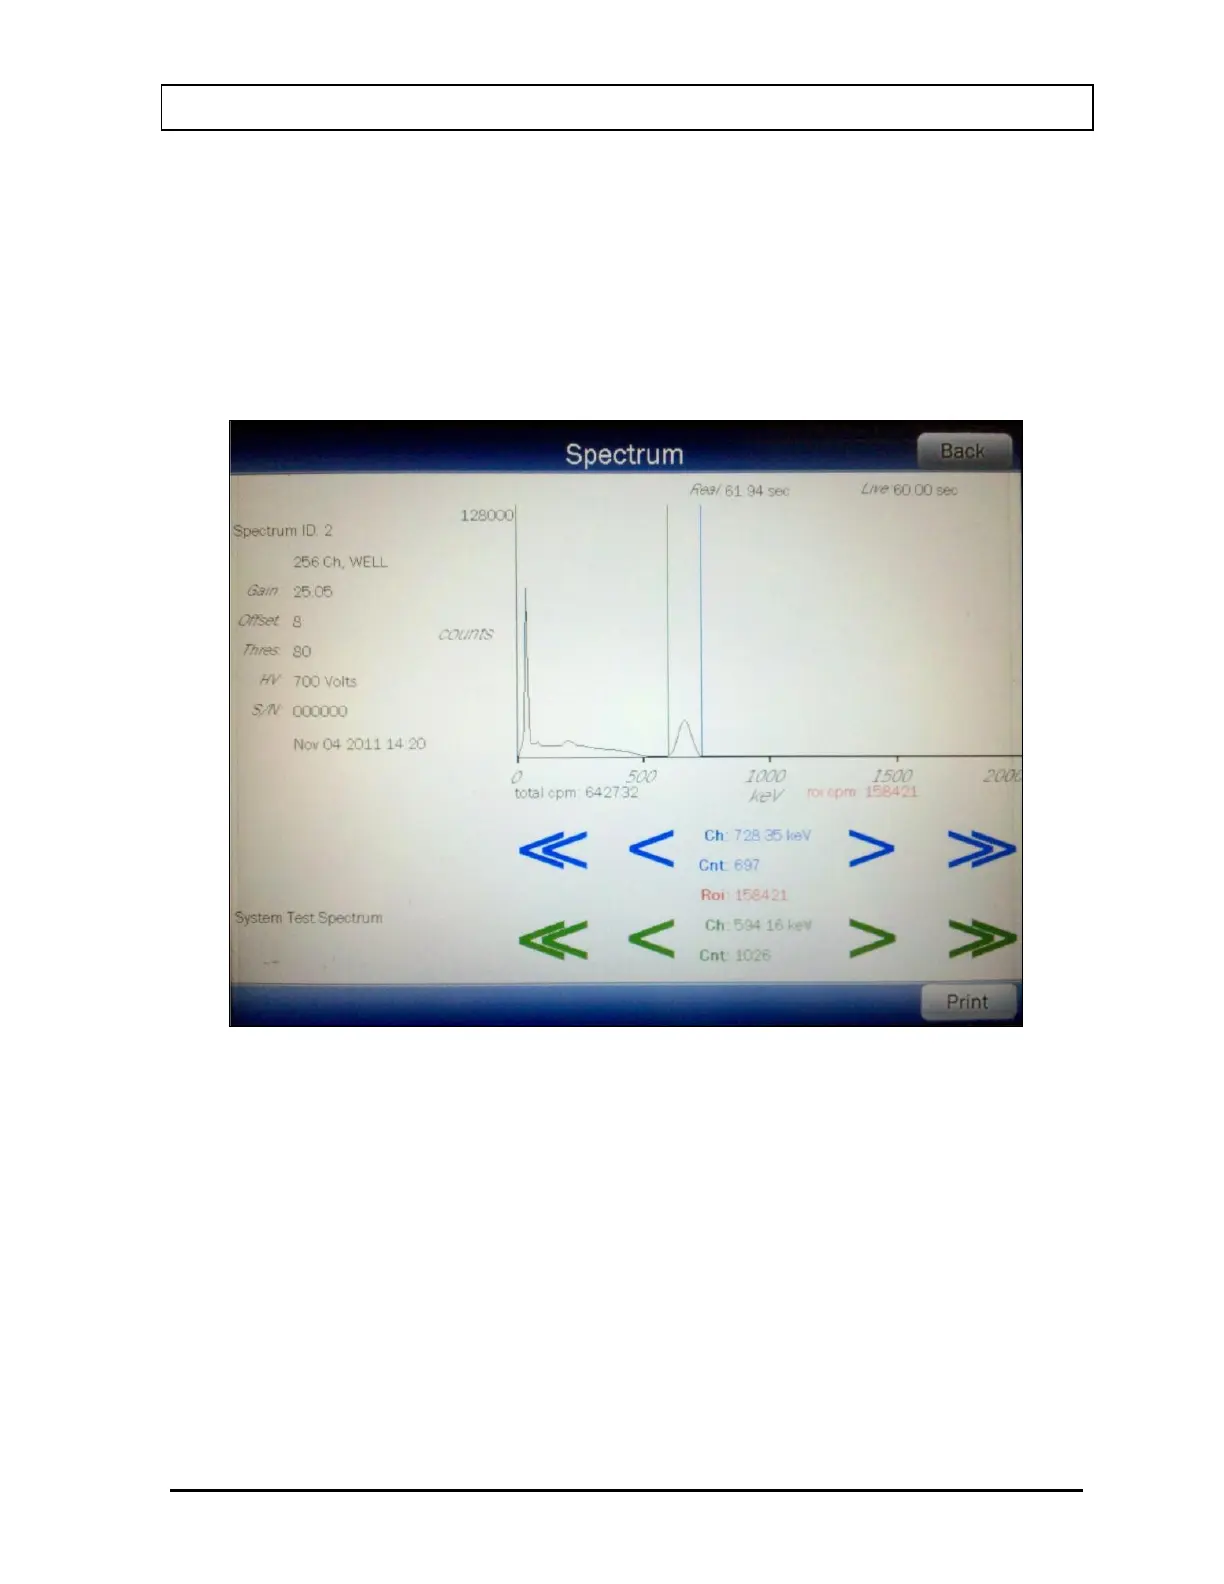
To view the Spectrum, touch the SPECTRUM button. Figure 9-11 System Test
Spectrum Screen will appear.
Figure 9-11 System Test Spectrum Screen
A Region of Interest may be defined using the BLUE and GREEN ARROW buttons to
place vertical line cursors around the ROI. DOUBLE ARROW buttons move the
cursor approximately 75 energy channels. SINGLE ARROW buttons move the cursor
approximately 7.5 energy channels.
Note: The actual energy channel keV will vary depending upon the Auto Calibration.
When the vertical cursor is moved, the channel energy (keV) and the number of
counts in that energy channel are displayed. Once the vertical cursors are set, the
total counts in the ROI are displayed.
To print the spectrum, touch the PRINT button.