CAPINTEC, INC. CAPRAC
®
-t
11-14 REPORTS April 2021
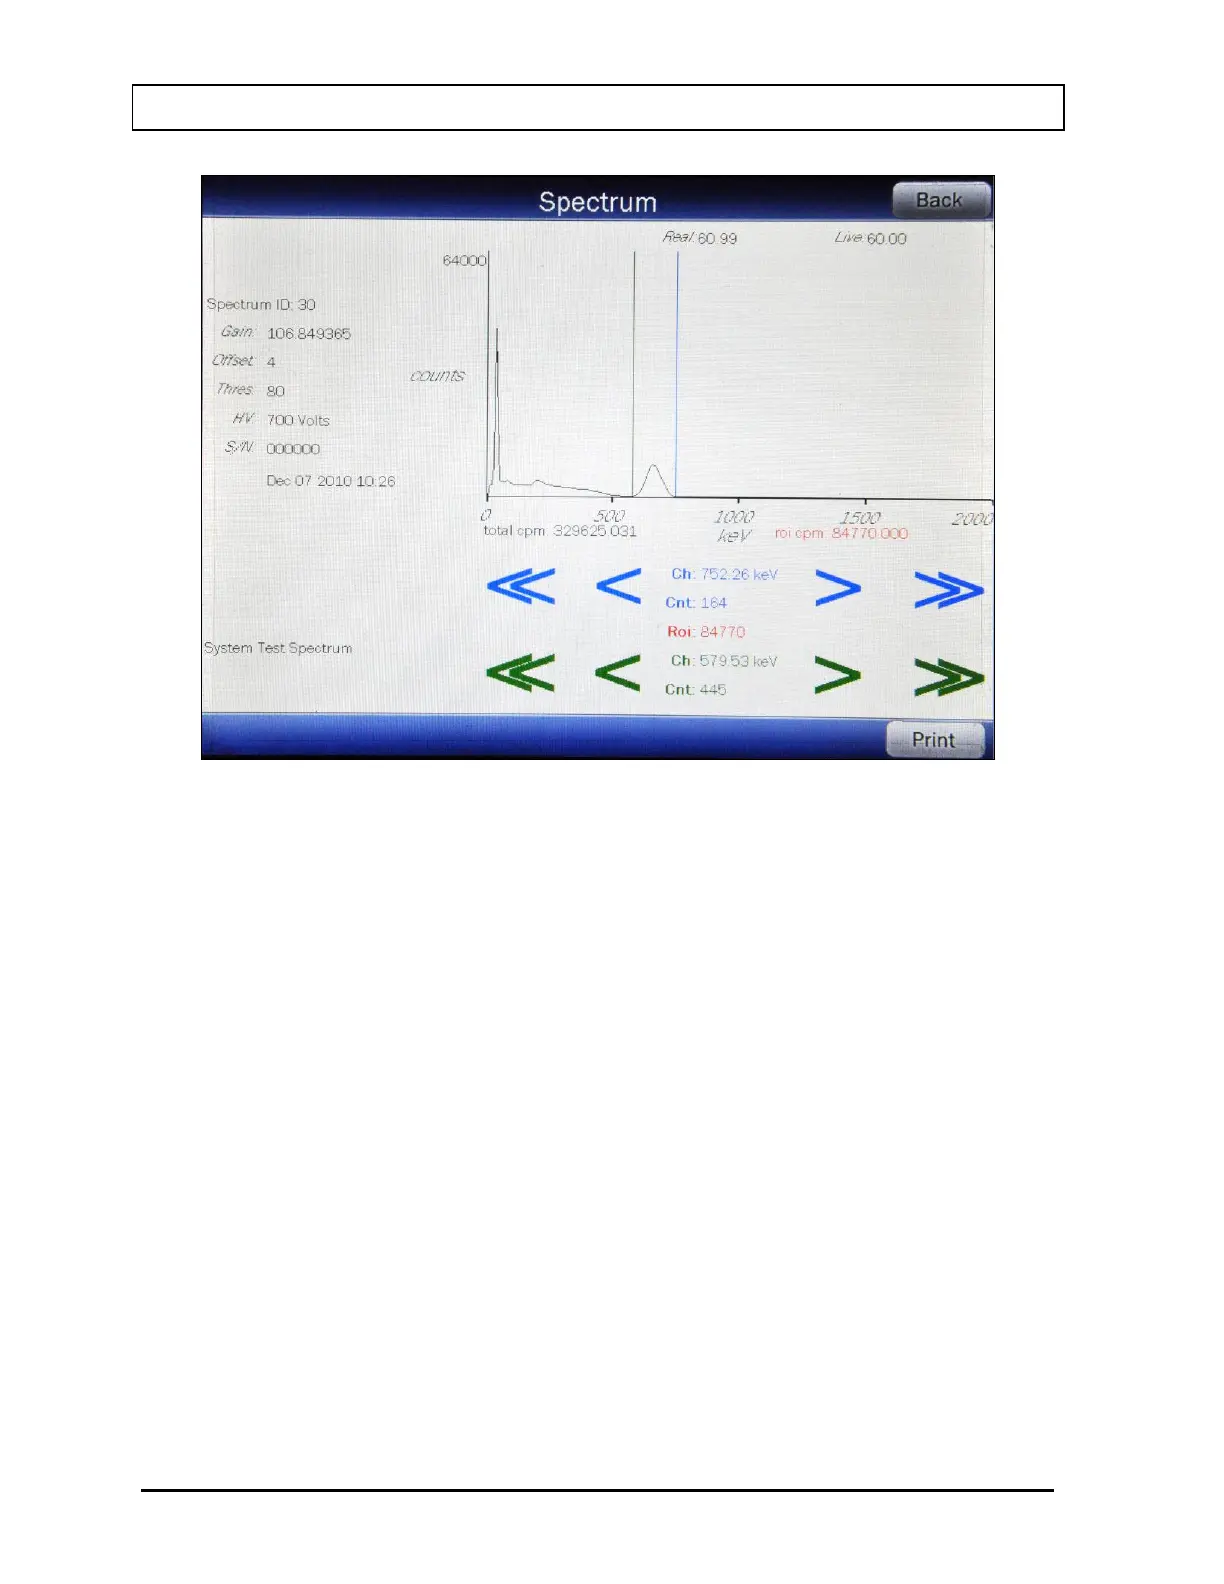
Figure 11-12 System Test Spectrum Screen
A Region of Interest may be defined using the BLUE and GREEN ARROW buttons to
place vertical line cursors around the ROI. DOUBLE ARROW buttons move the
cursor approximately 75 energy channels. SINGLE ARROW buttons move the cursor
approximately 7.5 energy channels.
Note: The actual energy channel keV will vary depending upon the Auto Calibration.
When the vertical cursor is moved, the channel energy (keV) and the number of
counts in that energy channel are displayed. Once the vertical cursors are set, the
total counts in the ROI are displayed.
To print the spectrum, touch the PRINT button.
To return to Figure 11-9 System Test Result Screen, touch the BACK button.
View Background Spectrum
To view the spectrum of the background that was measured previous to the selected
System Test, touch the blue highlighted Background Activity: count rate box. The
screen will appear similar to that shown in Figure 11-12 System Test Spectrum
Screen. The operation of the ARROW buttons is the same as described above.