Part III: Background and Concepts
To better understand how the sum of all captures is not a peak hold, imagine that each acquisition is
“superimposed” over the previous accumulated traces. To illustrate:
Capture 1: Capture 2:
Capture 3: Capture 4:
Overlaying each capture produces their sum:
The larger the span setting, the longer the FFT capture time to ensure 100% POI (Probability Of Interception).
This is because the FFT times (in the table above) have been calculated to ensure that the DS2831 will not
only capture while the modems are up and transmitting data up to the CMTS, but also during those quiet
times (time ticks equal to 6.25us) when the CMTS requires all modems to keep quiet so that it may listen for
any new potential modems wanting to register.
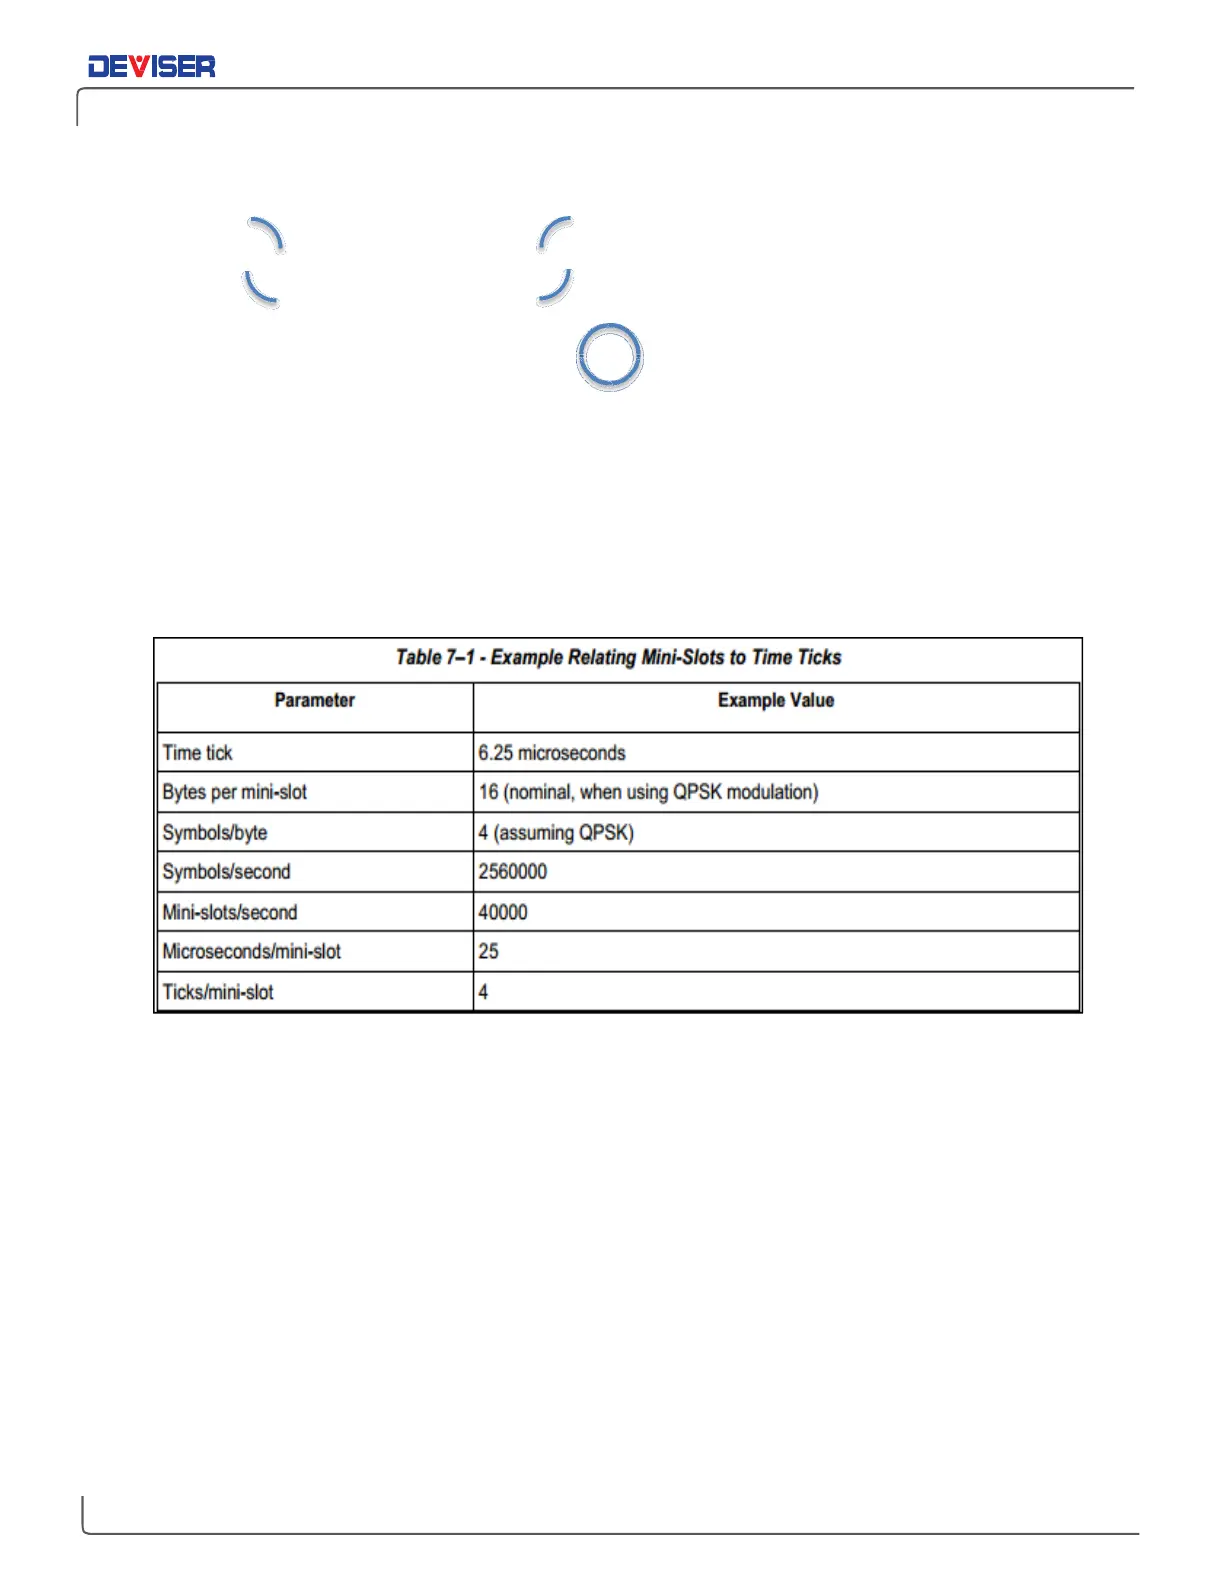
The table below is extracted from page 175 of a DOCSIS white paper document, CM-SP-MULPIv3.0-I25-
140729. It shows how Time Ticks are calculated based on modulation type.
In our discussion, we have seen the technology in use; but we have not yet explored how it relates to the
day-to-day task of troubleshooting ingress in the field.
Traditional techniques for locating service distortions are no longer the best approach for maintaining
customer services. In most cases, a field engineer refers to their MSO monitoring platform and is notified that
a particular node shows signs of issues. (For example, the HE or Hub monitoring system may detect coherent
distortions in that node).
Problems occur, however, when the network engineer reaches the node. He or she must determine which
of the node’s 4 legs is malfunctioning. Common practice is to pull the return pads and view the Upstream
RF monitoring system signature, which – in theory - should include the distortion in question) If the signature
goes away after pulling the pad, the field engineer will know that the distortion comes from that leg. If not,
he (she) will replace the pad and pull another until he finds the culprit.