51
dotted marker line represents one that is movable
using the Tuning Knob. Set this marker to a point
of interest on the display and then press the
"toggle marker" softkey to make the other marker
movable for similar positioning with the Tuning
Knob. Digital displays adjacent to "Mrkr:"
continuously show the relative level and
frequency difference between the two points
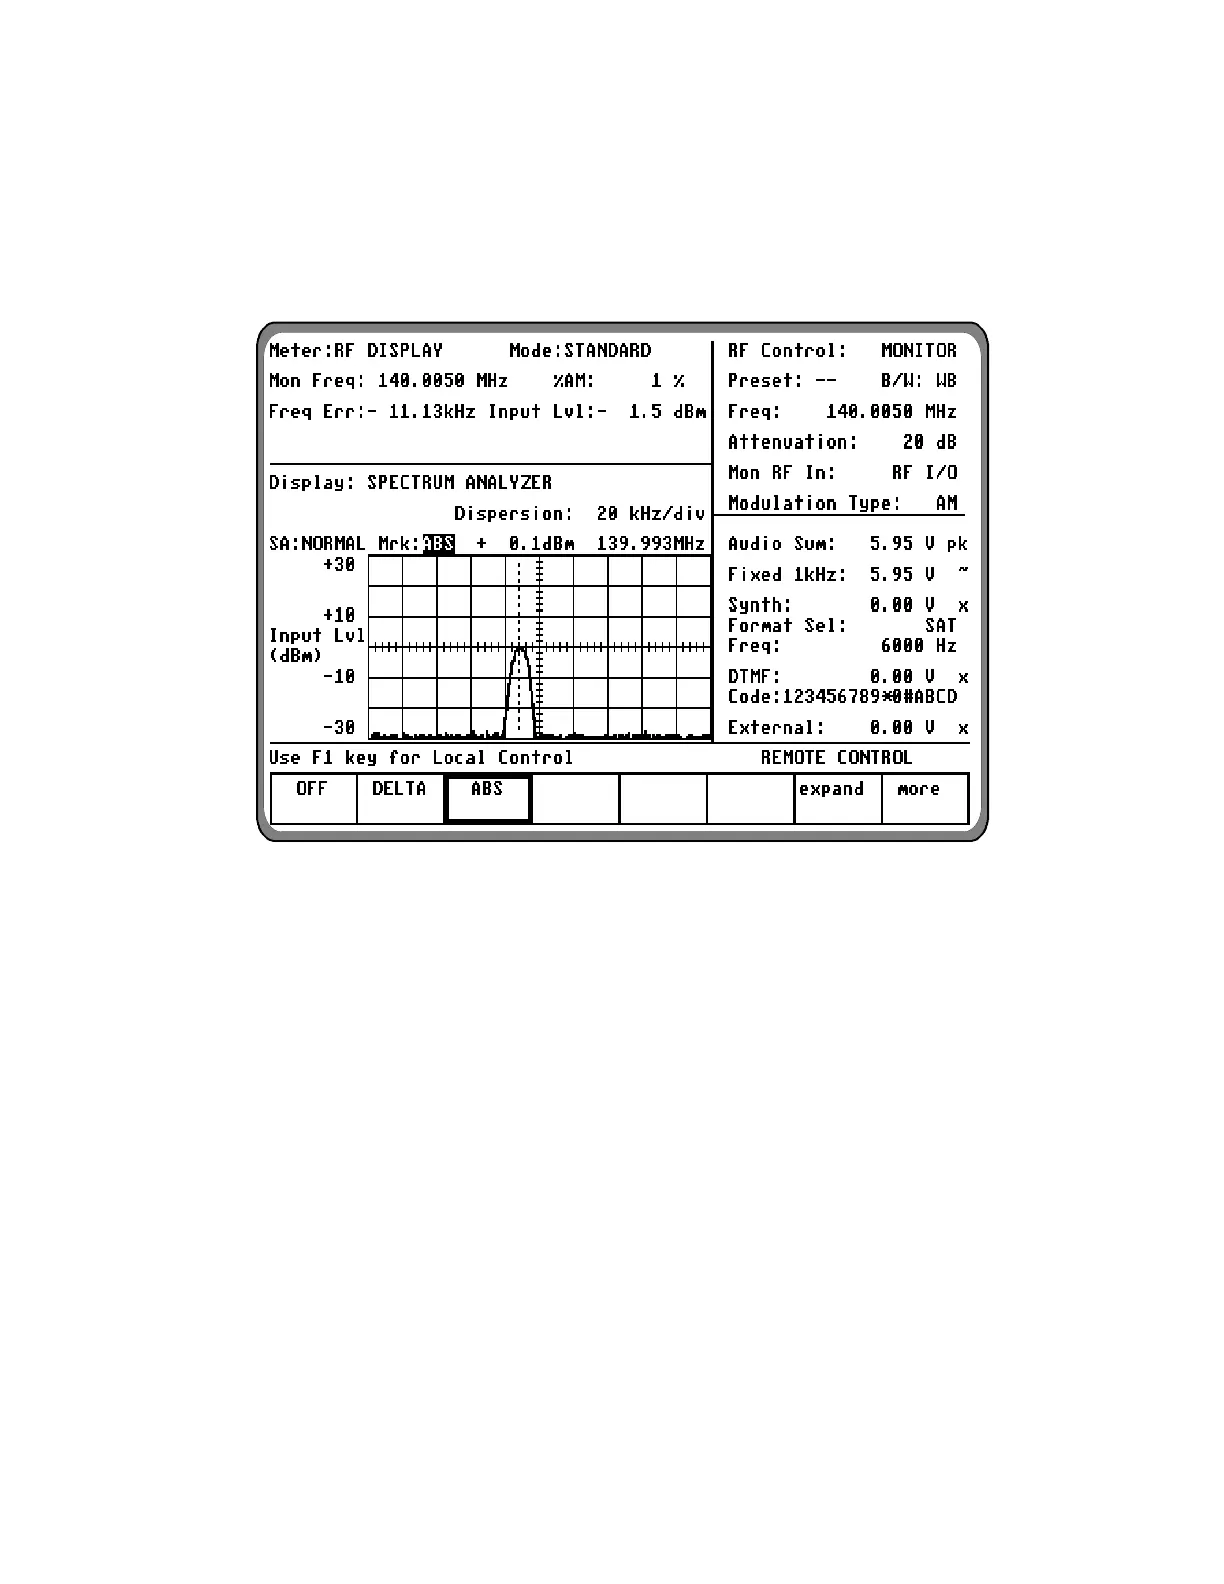
selected. Selection of ABS (absolute) mode pro-
vides one marker set using the TUNING knob.
Absolute frequency and power level of the
marker location is displayed.
Figure 3-19. Spectrum Analyzer Markers (Option)
In conjunction with the markers are a set of
softkey controls that allow the dashed marker to
be moved depending upon the information
displayed on the graph. These controls are
available for both the DELTAT and ABS marker
selections by pressing the more softkey.
max peak
Find the maximum peak on the graph.
right peak
Find the next highest peak to the right of the
current position of the dashed marker.
The spectrum
analyzer mode and marker
functions are available in the expanded display
graph. The provided functions are identical to
those found in the normal size display. Normal to
expanded screen selections may require
readjustment of the markers positions.
next peak
Find the next highest peak to the left or right of
the current position of the dashed marker.
center freq
Move to the center frequency of the spectrum
analyzer. This is equivalent to centering the
dashed marker on the monitor frequency.
left peak
Finds the next highest peak to the left of the
current position of the dashed marker.
 Loading...