3-7.2 Display
Any of the following graphic data displays can be
selected for simultaneous display along with the
previously discussed meter displays. Select using
softkeys from the "Display:" field in the Display
zone.
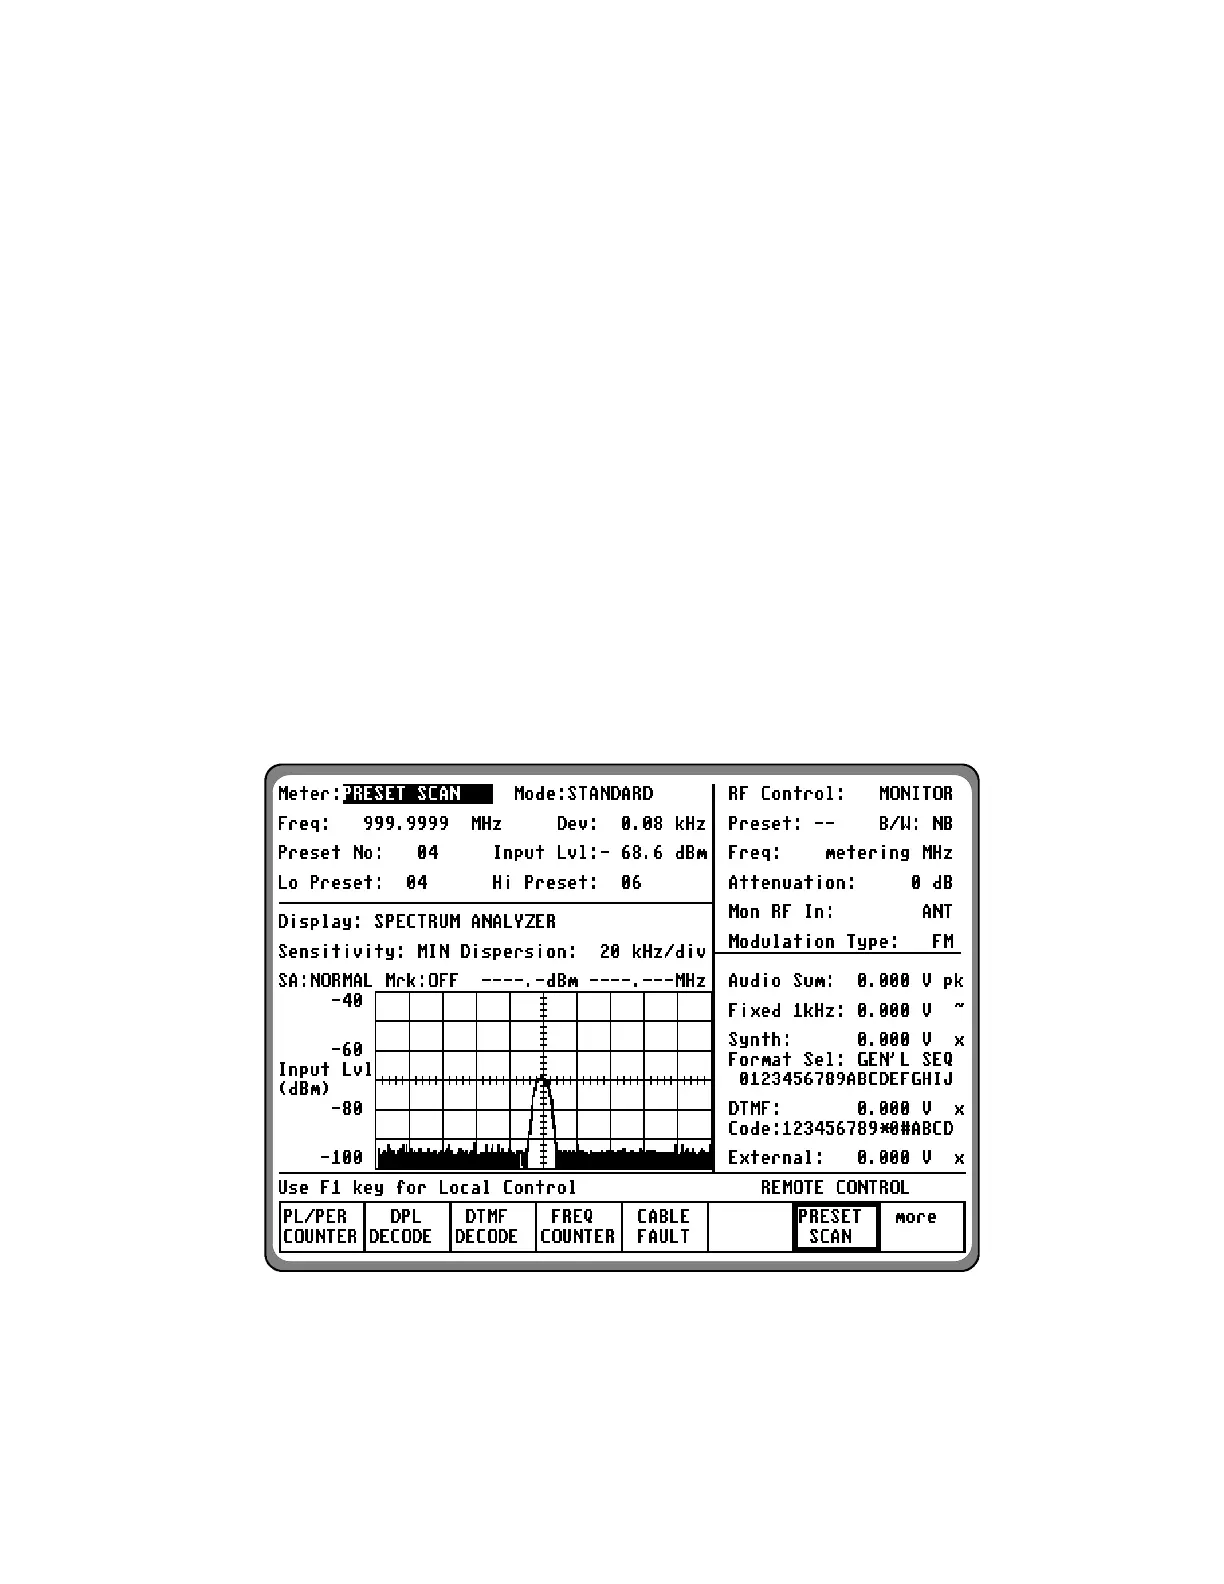
3-7.2.1 Spectrum Analyzer
The Spectru
m Analyzer (figure 3-18) is active in
the MONITOR or DUPLEX modes. Move the
cursor to the "Display:" field within the Display
zone.
Select SPECTRUM ANALYZER by pressing the
softkey. The input frequency spectrum is dis-
played in a frequency-versus-amplitude (dBm)
graph. Either the ANT or RF I/O port may be
selected for input from the "RF Control:" zone.
The amount of input attenuation may also be
selected within the zone to vary the sensitivity of
the Spectrum Analyzer.
If a larger display area is desired, press the
expand softkey. (A return softkey is available in
the expanded mode allowing return to the normal
display).
NOTE
If SPECTRUM ANALYZER is selected while
"RF Control:" is in the GENERATE mode, the
spectrum analyzer will be disabled and the
background will show the message Spectrum
Analyzer Disabled in Generate Mode. If
SPECTRUM ANALYZER is selected while RF
CONTROL is in the SCAN mode, the spectrum
analyzer will be disabled and the background
will show the message scanning.
Figure 3-18. Spectrum Analyzer
49
 Loading...