SMART
H000002007-RDS User Manual │Version 5.0.0 (2018-09-17) │161
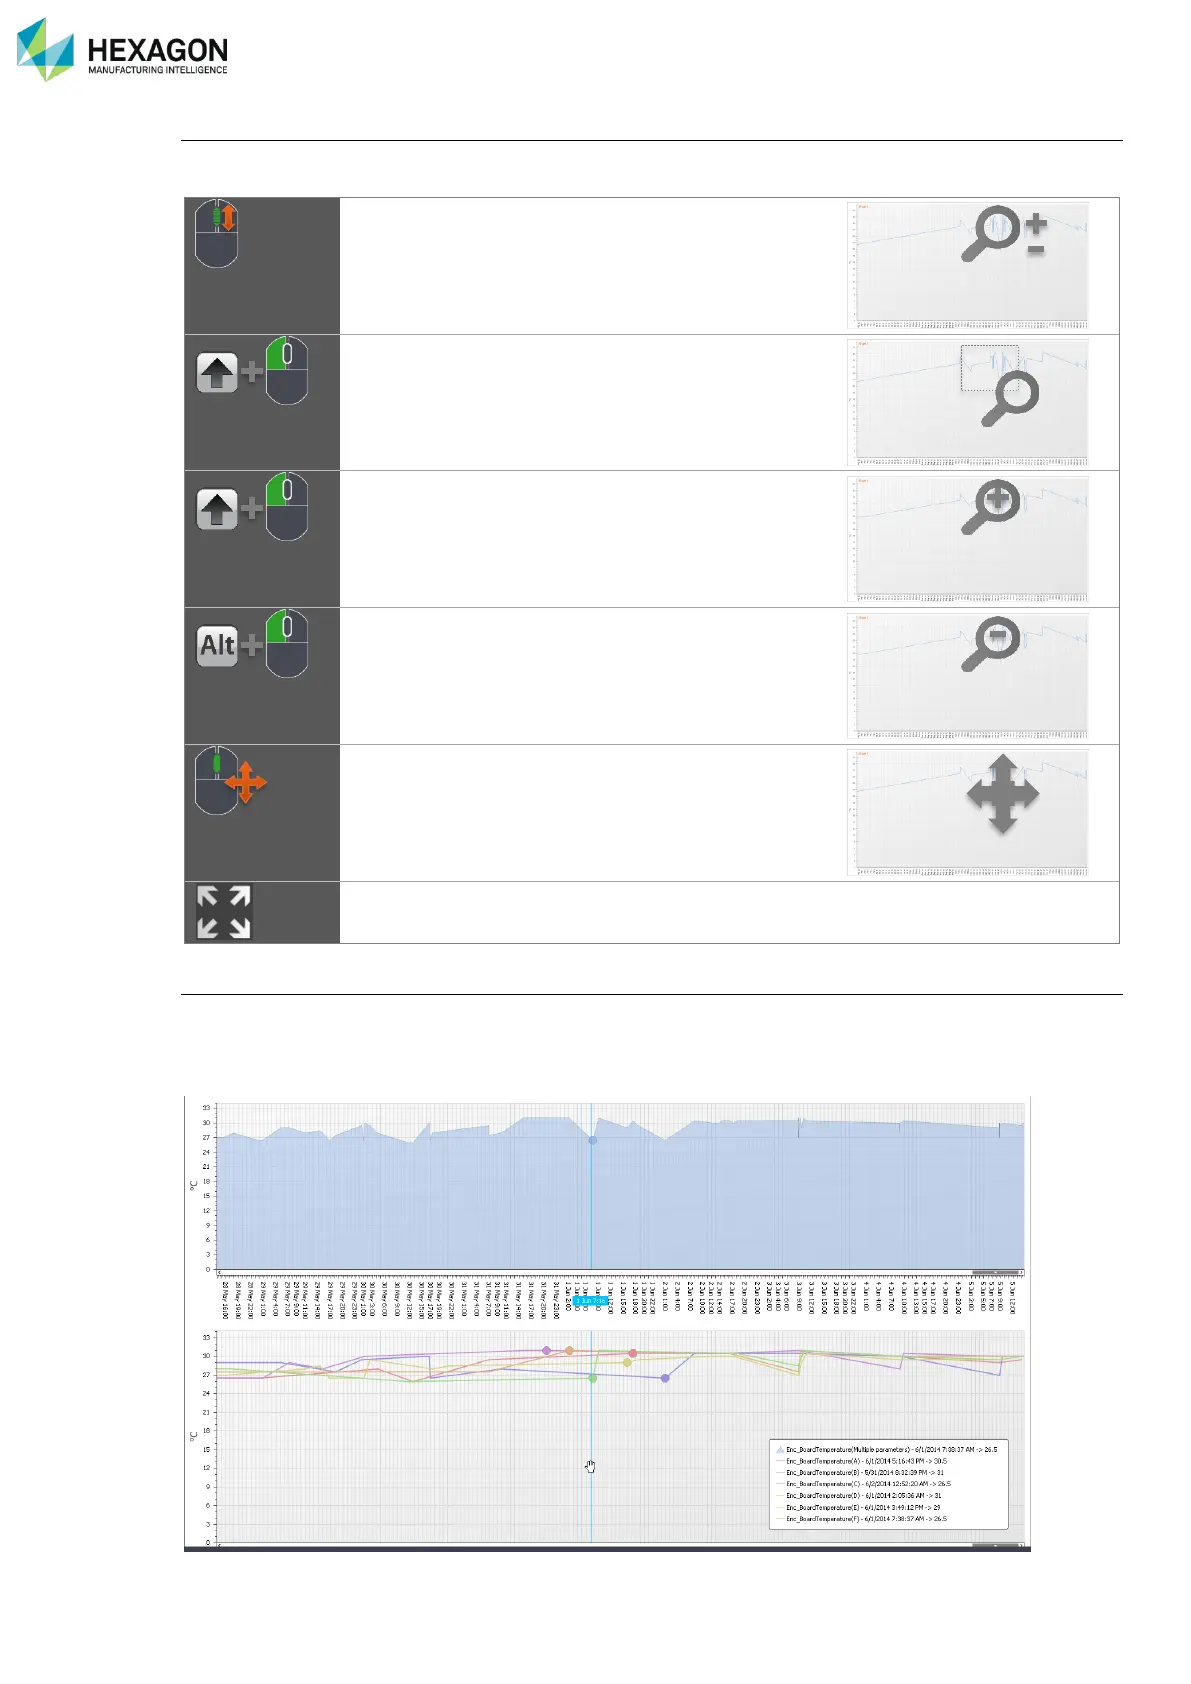
Zoom the chart
In addition to the available cursors to control the time range, the mouse wheel can be used to zoom the
chart, on X and Y axis. Then the middle button (wheel button) can be used to pan the graph.
Mouse wheel
Zoom on X and Y axis scales on the pointer location
Shift key + Pan Left button
Zoom in a box
Shift key + Left click
Zoom in on the pointer location
Alt key + Left click
Zoom out on the pointer location
Mouse middle button
Pan the zoom on X and Y axis
Action button
Refit to all the graph
Check the values
Whatever one or several indicators are displayed on one or several graphs, to survey the graphs values,
just place the pointer over the graph at the desired time position. A line shows the current position, and the
nearest graph points are shown. A small window beside the pointer displays the values of all the curves for
the current position.