I
-
I
-
Using Instrument Functions
Using Markers
If a marker is on, two or three lines of numbers follow the marker annotation:
Cartesian
frequency
r
response
Polar
frequency
magnitude
phase
Smith Chart
frequency
1
resistive velue
reactive value
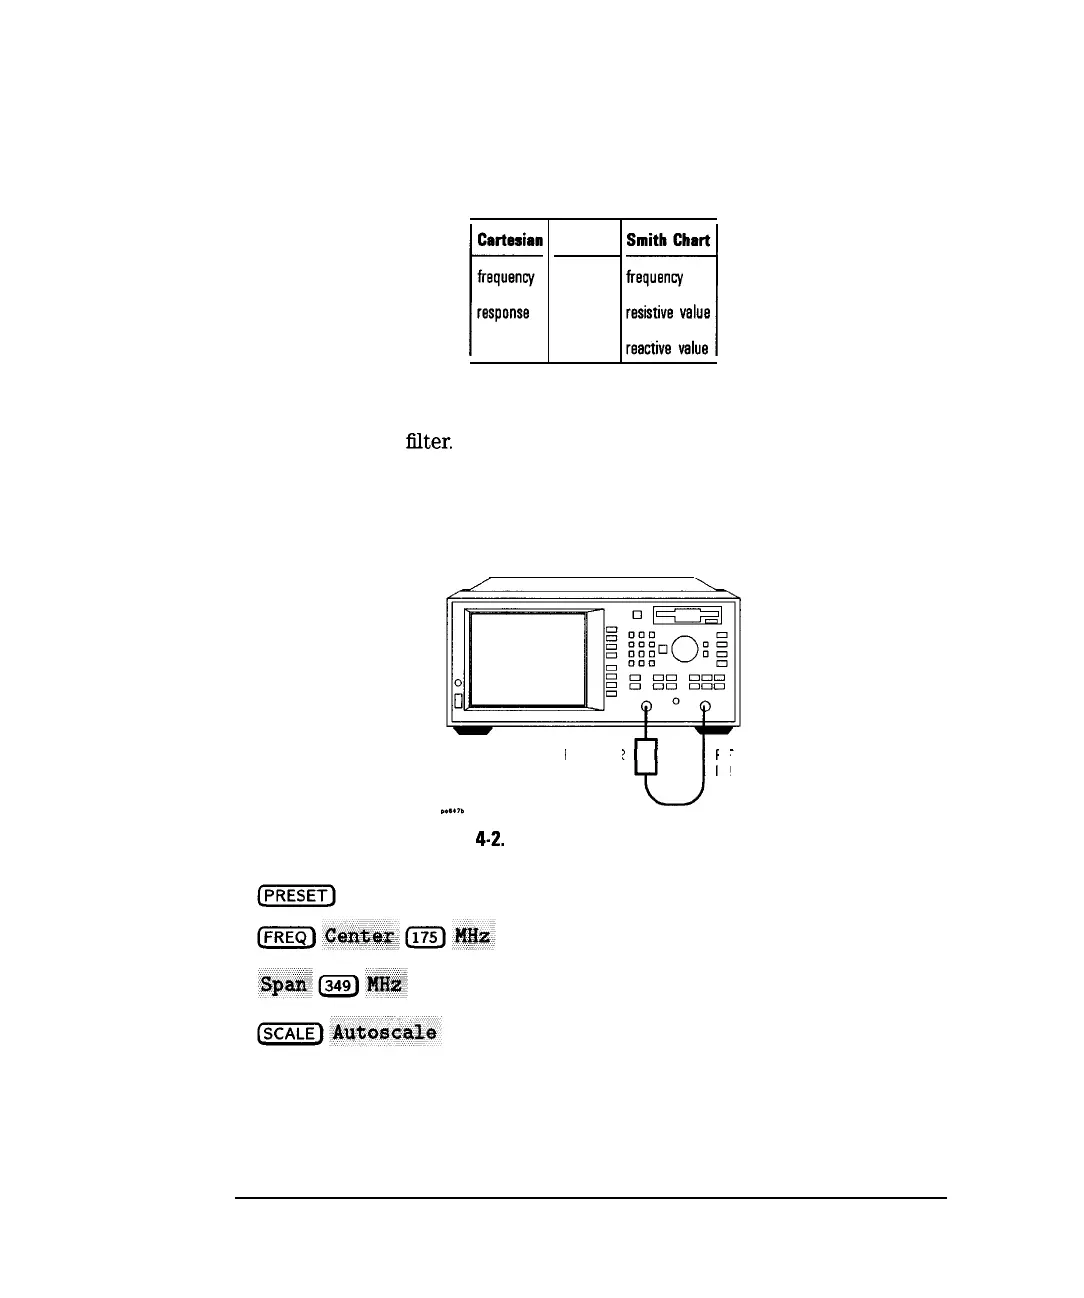
The examples in this section are shown with a transmission response
measurement of a
flter.
‘lb follow along with these examples, use the filter
that was shipped with your analyzer, connect the equipment as shown, and
set up the analyzer by pressing the keys shown below the equipment setup.
NETWORK ANALYZER
D.S.Ib
D.S.Ib
Figure 4-2. Connect the Filter to the AnalyzerFigure 4-2. Connect the Filter to the Analyzer
FILTER
RF
IN
4-4
I-