I
-
Using Instrument Functions
Using limit Testing
Example 1.
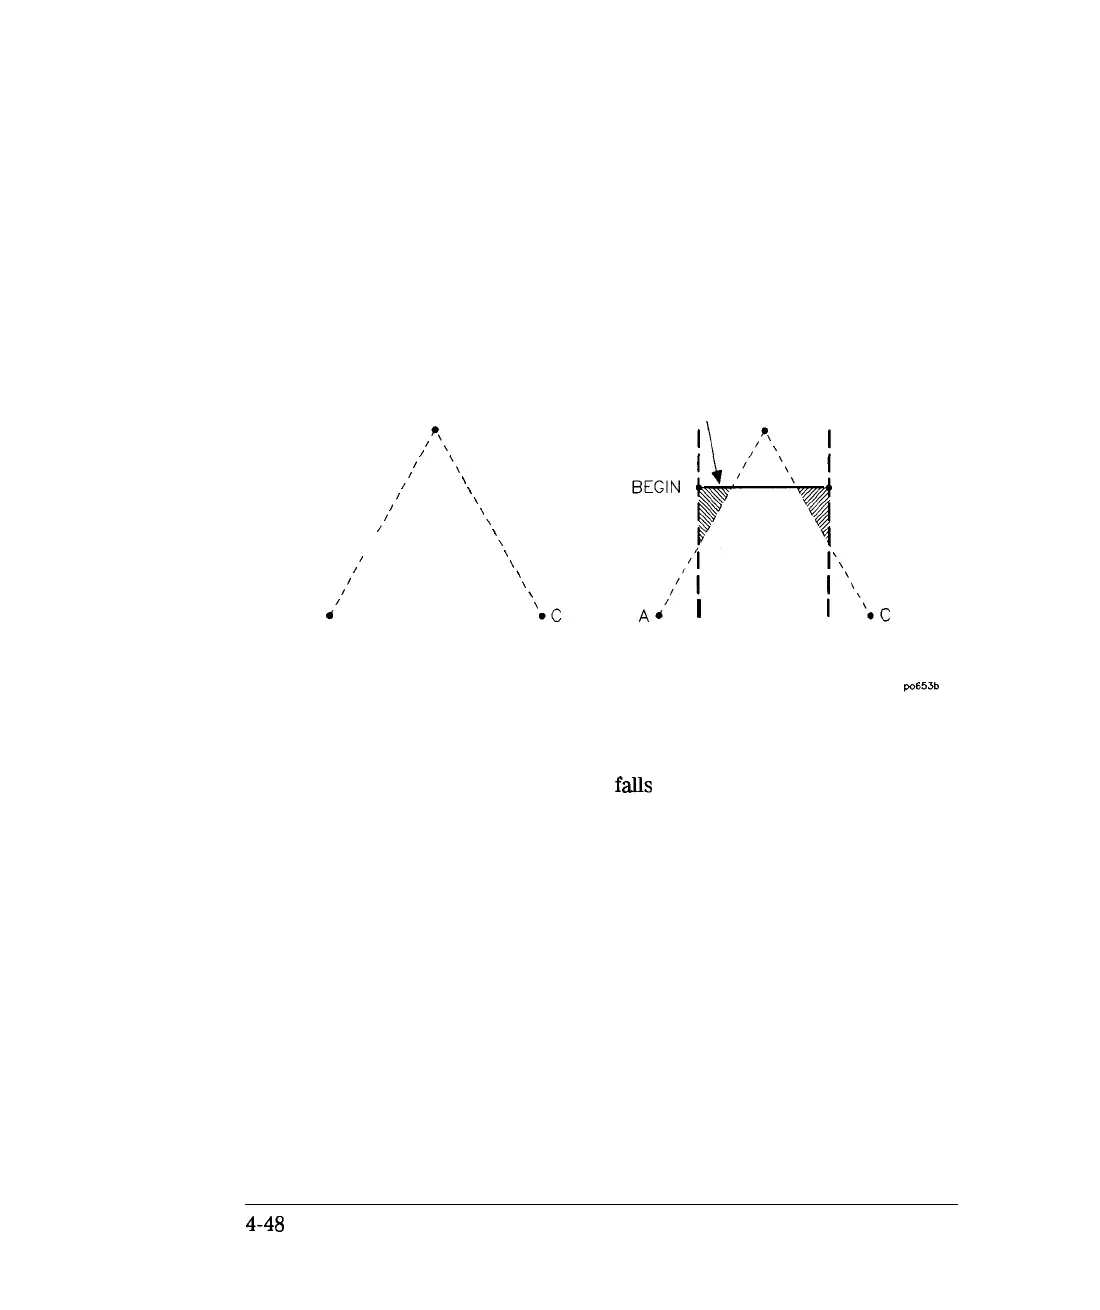
When using a small number of measurement points, limit lines must be set
carefully, or the results may be confusing, because the analyzer connects
the measurement points with straight lines. The following illustration shows
a data trace with three measurement points: A, B, and C, along with a
minimum limit line.
B
3,
I’
I/
‘\
\
\
1’
\
,I
\
\
\
I’
\
\
/’
\
I’
\
\
\
A
d’
\
DC
TRACE SHOWING
THREE MEASURED POINTS
MINIMUM
LIMIT LINE
7
B
END
Ad’
1
Figure 4-17. limit lines Example 1
Note that the beginning of the limit line
falls
between points A and B along
the horizontal frequency axis. The end of the limit line falls between points B
and C along the frequency axis. Therefore, only one measurement point is
encountered between the beginning and end of the limit line. This particular
example would result in a limit test result of “PASS” when it appears
that it could fail. More measurement points are needed to evaluate this
measurement.
4-48