Using Instrument Functions
Printing and Plotting Measurement Results
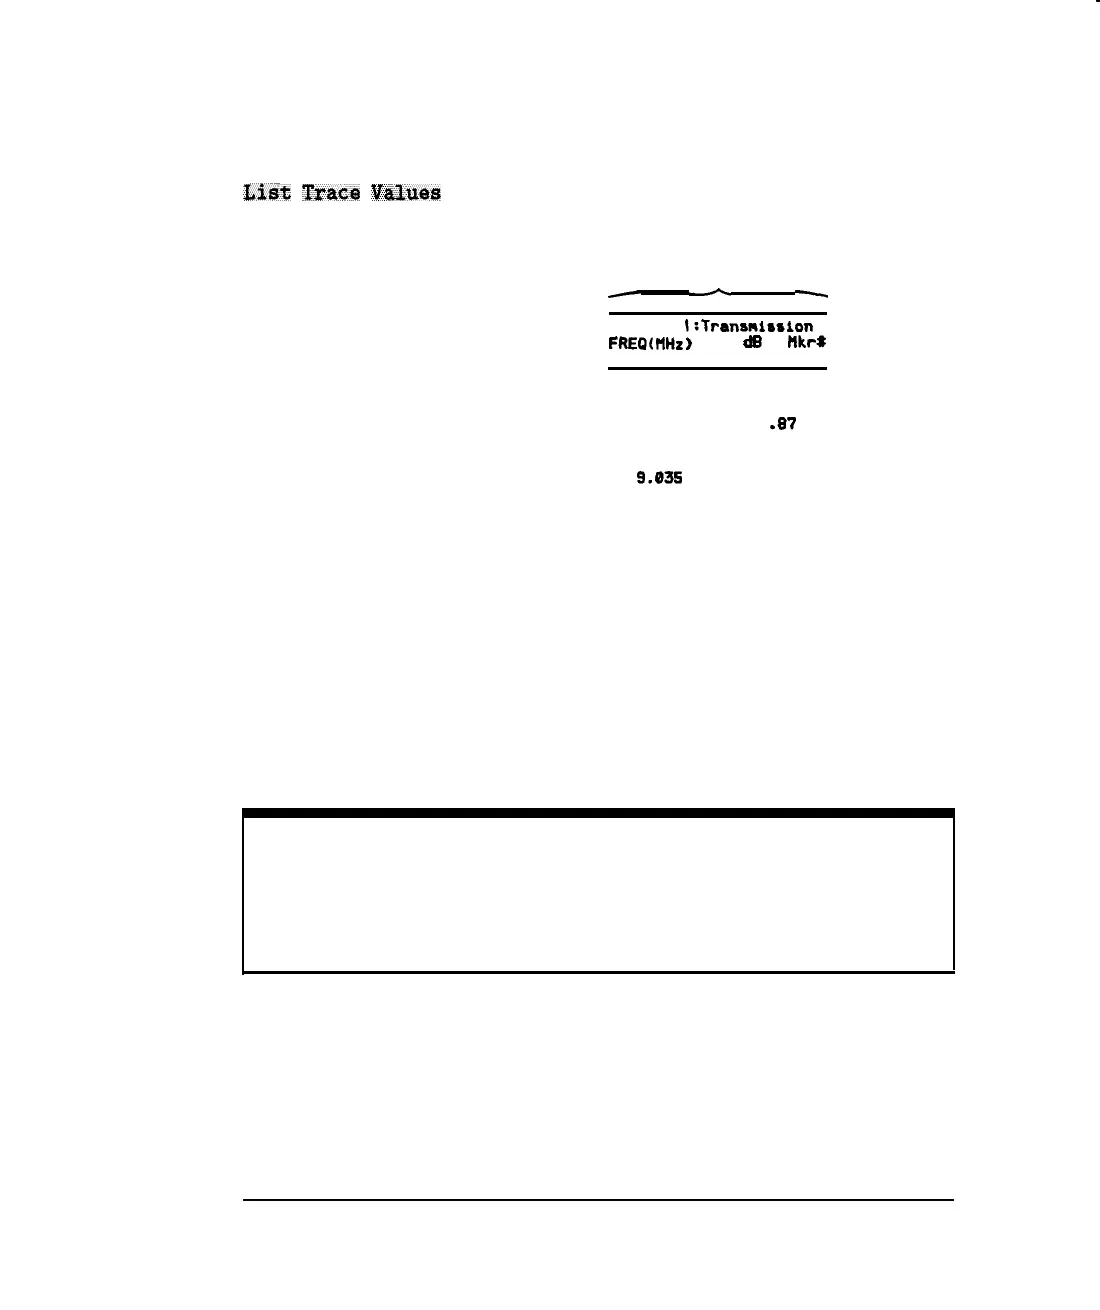
List
Tmcs
Values
outputs a list of the data trace point values. (This
selection is only available for output to a printer.)
Trace Values
-
-
-
CHANNEL
I:Trananirsion
FREP(
HHz
)
da
Ilkr#
9.300 -47.91
2.047
-66.92
3.794
-71 .a7
5.541
-76.94
7.288
-82.18
9.03s
-89.23
10.782
-77.77
12.529
-82.95
14.276
-89.84
16.023
-85.46
17.770
-79.86
19.517
-88.97
21.264
-89.75
23.011
-83.53
24.758
-87.51
26.505
-84.91
28.252
-83.51
29.999
-86.01
Figure 4-27. Trace list Values
NOTE
Figure 4-27 shows the trace list values for a transmission measurement in log mag format. Trace
values for polar format will be frequency, magnitude, and phase; while trace values for Smith chart
format will be frequency, resistance, and complex impedance.
4-94