76 User’s Manual INNOMAR Parametric Sub-Bottom Profilers / SESWIN
76 Innomar Technologie GmbH (2023-01)
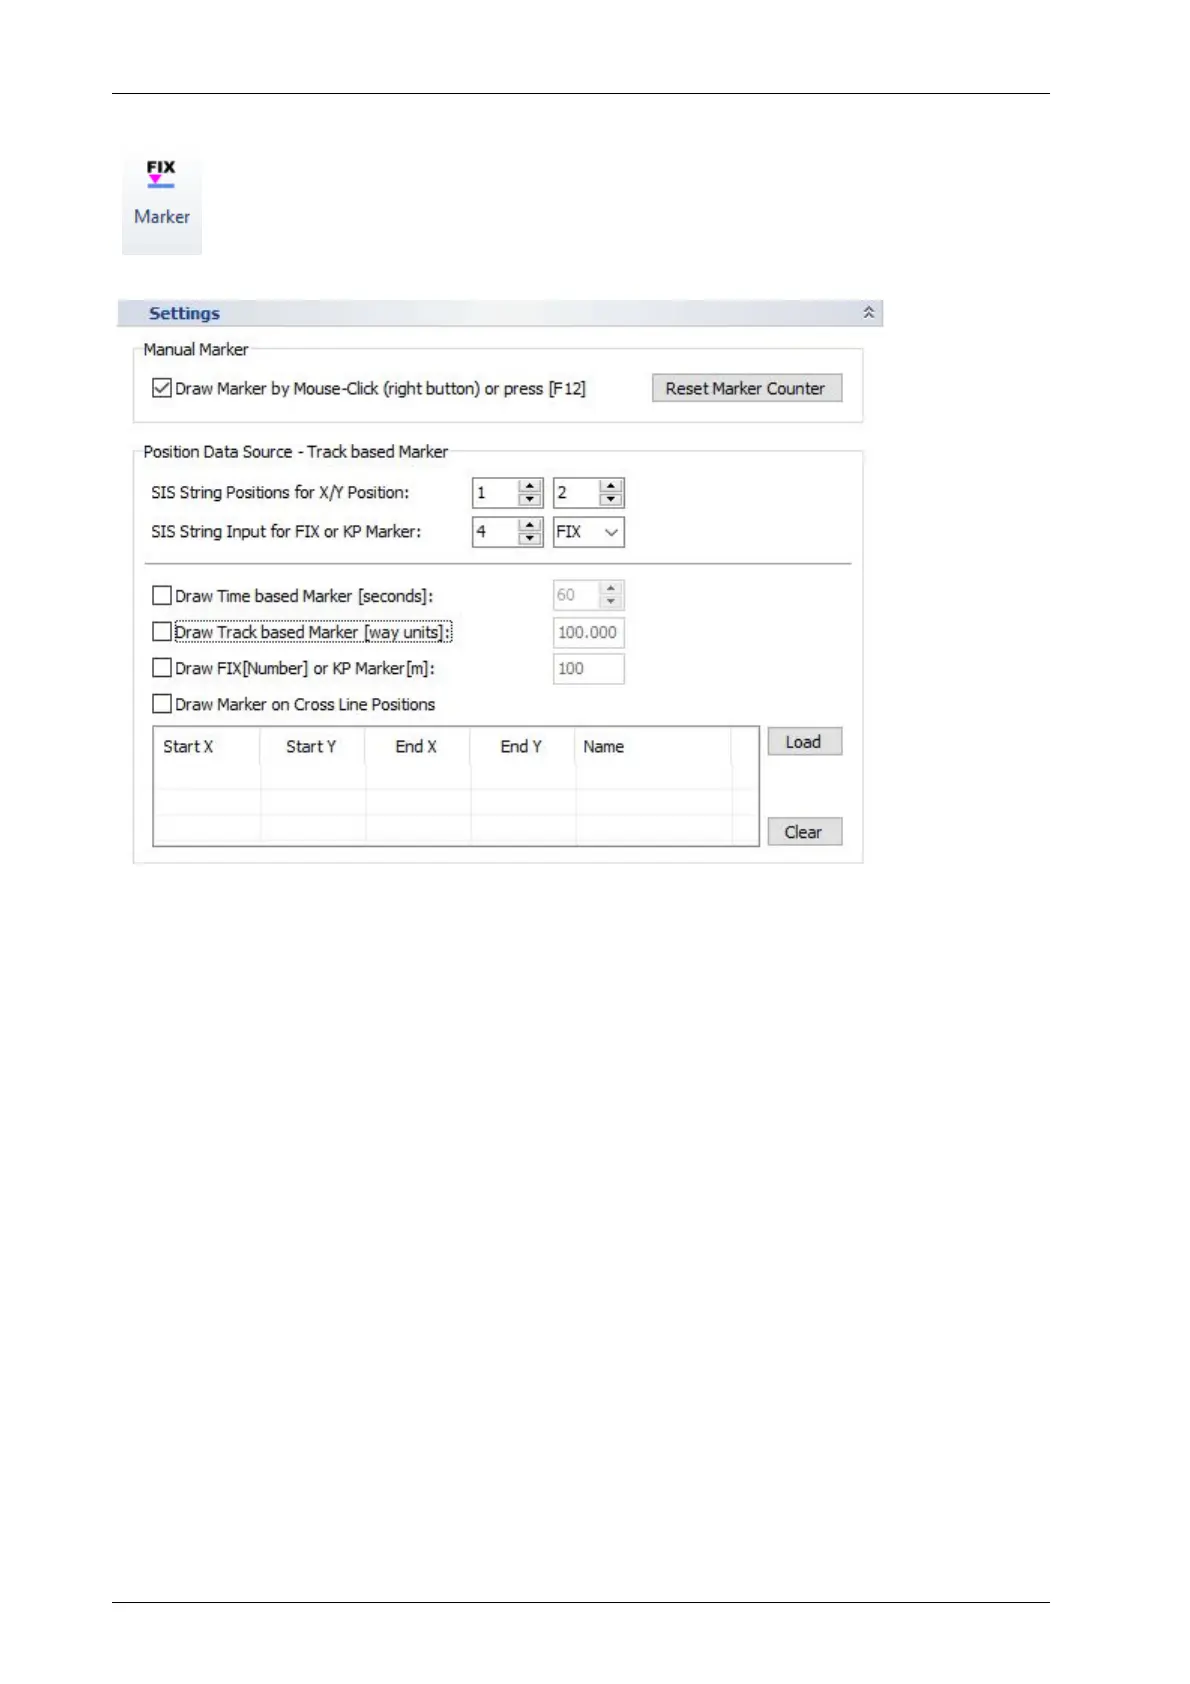
5.11.17 System Setup – Settings – Marker
It is possible to set manual markers as well as have marker lines drawn automatically
into the echo plot based on either track made good, time or KP.
Manual marker positions will be stored within the data file while automatic markers
are for online orientation only and will not be stored (but can be generated in post-
processing again).
Manual Marker: These can be set by using the right mouse button in the echo print (can be
disabled here) or by pressing the [F12] key. There is a marker counter that can be reset to “1” by
the “Reset Marker Counter” button.
Position Data Source: Select which SIS position contains the X and which one contains the Y
position that shall be used for track (way unit distance) markers.
Draw Time Based Marker (seconds): If checked markers are drawn on the screen of the
INNOMAR system and printed on the echo plots based on the time. The time between two marks
has to be defined in a range of 1 to 600s.
Draw Track Based Marker (way units): If checked markers are drawn on the screen of the
INNOMAR system and printed on the echo plots based on the track made good. The distance
between two track marks has to be defined. Distance is calculated using SIS strings defined for
X and Y coordinates regardless the units. Only by using a rectangular system (UTM for instance)
these values will correspond to metres.
Draw Fix or KP Marker: If checked markers are drawn based on changes of a SIS string value
specified above (“SIS ID for Fix or KP Marker”). Increments are given and used including
decimals. The marker line will be labelled with this SIS string.
Draw Marker on Cross Lines: If set, vertical markers will be plotted on the crossings with the
specified lines. Load a list with position information of specified lines that may cross the actual
survey profiles. At any position, where these lines are crossed, a marker will be drawn into the
echo plot together with the Cross-Line Name from the table.