CIBANO 500 PTM User Manual
96 OMICRON
Add graphics
To add a graphic to the report template:
1. In the Report Model view, select the graphic you want to add to the report template.
2. In the Excel worksheet, select the cell where you want to place the graphic.
3. Click Add Picture on the ribbon.
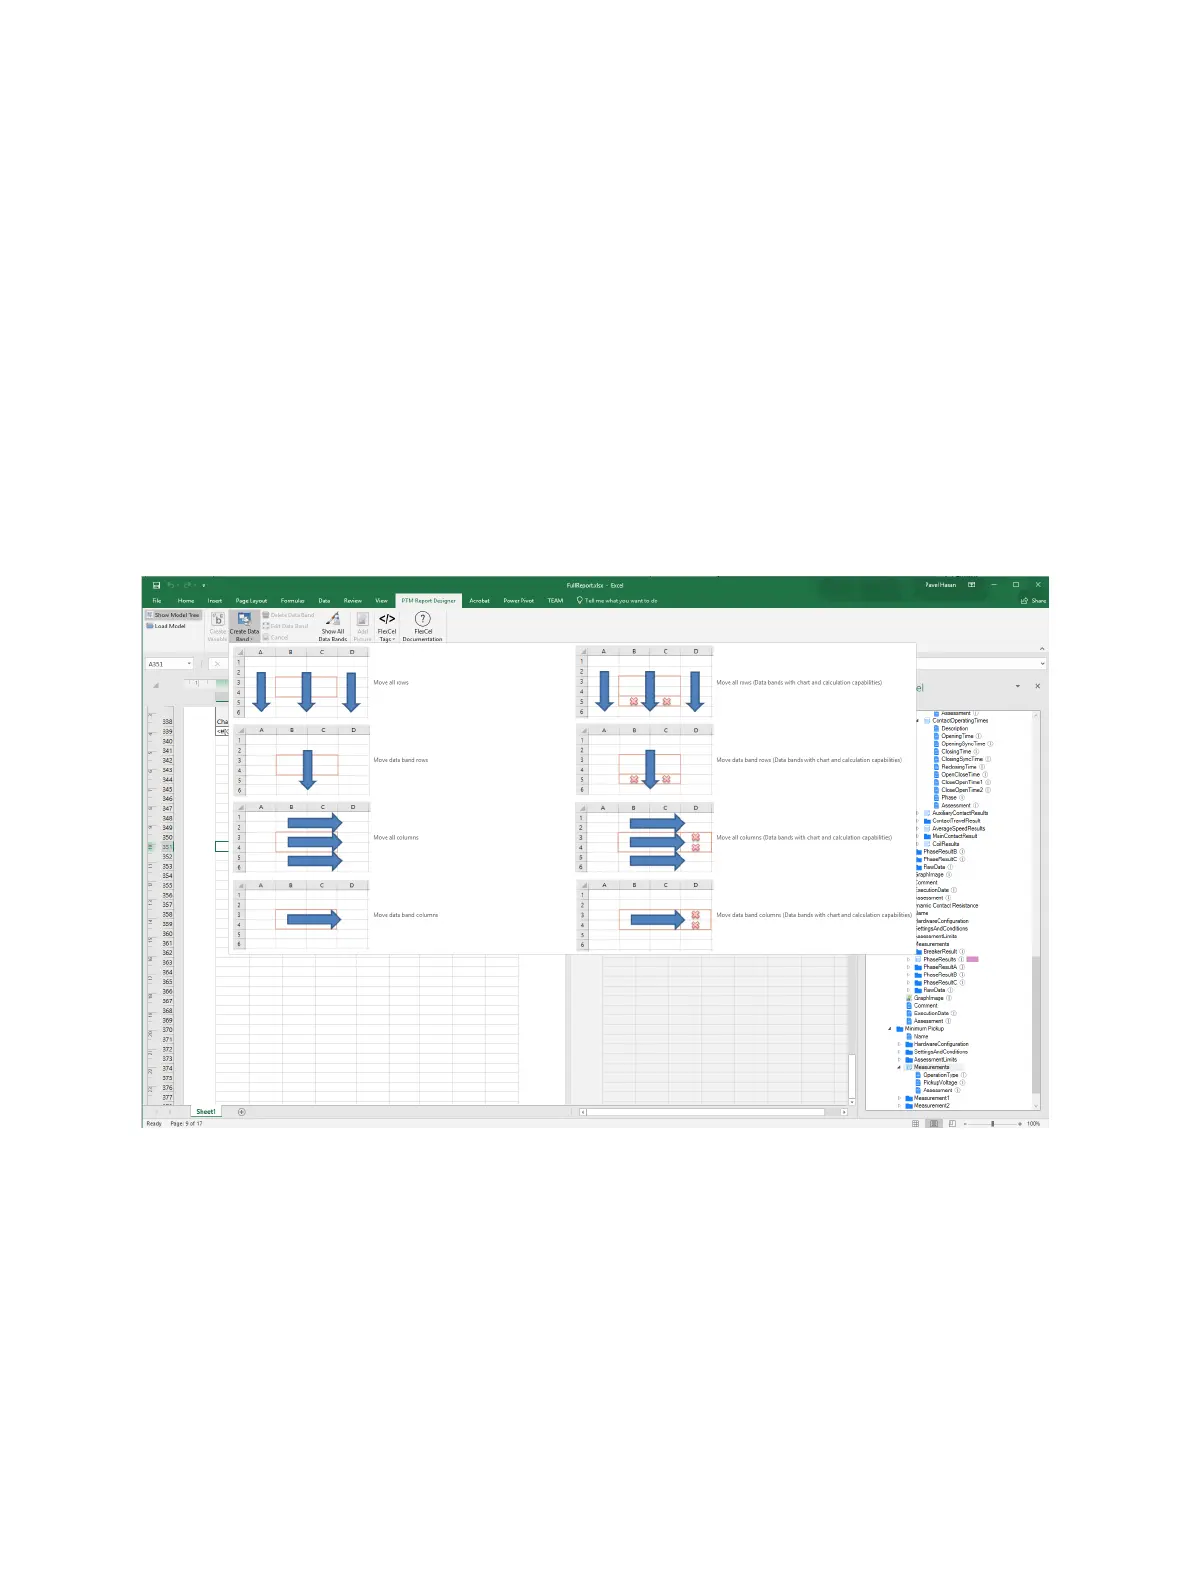
Create data bands
Some data in the report model can be organized in a list format. You can represent this data in the report
template by data bands. To create a data band:
1. Select a list item from the Report Model view.
2. In the Excel worksheet, select the cells where you want to place the data band.
3. Click the Create Data Band button on the ribbon, and then select the data band type.
Figure 13-3: Data band types
4. After the data band has been created, the list item in the Report Model view is marked by a colored
rectangle.
13.3 Adding reports from file
The Existing reports area displays the test reports available for the job. In addition to the test reports
generated by Primary Test Manager, you can add other reports to jobs. To add a report to a job:
1. In the Existing reports area, click Add report from file.
2. Browse to the report you want to add to the job.
 Loading...