CIBANO 500 PTM User Manual
90 OMICRON
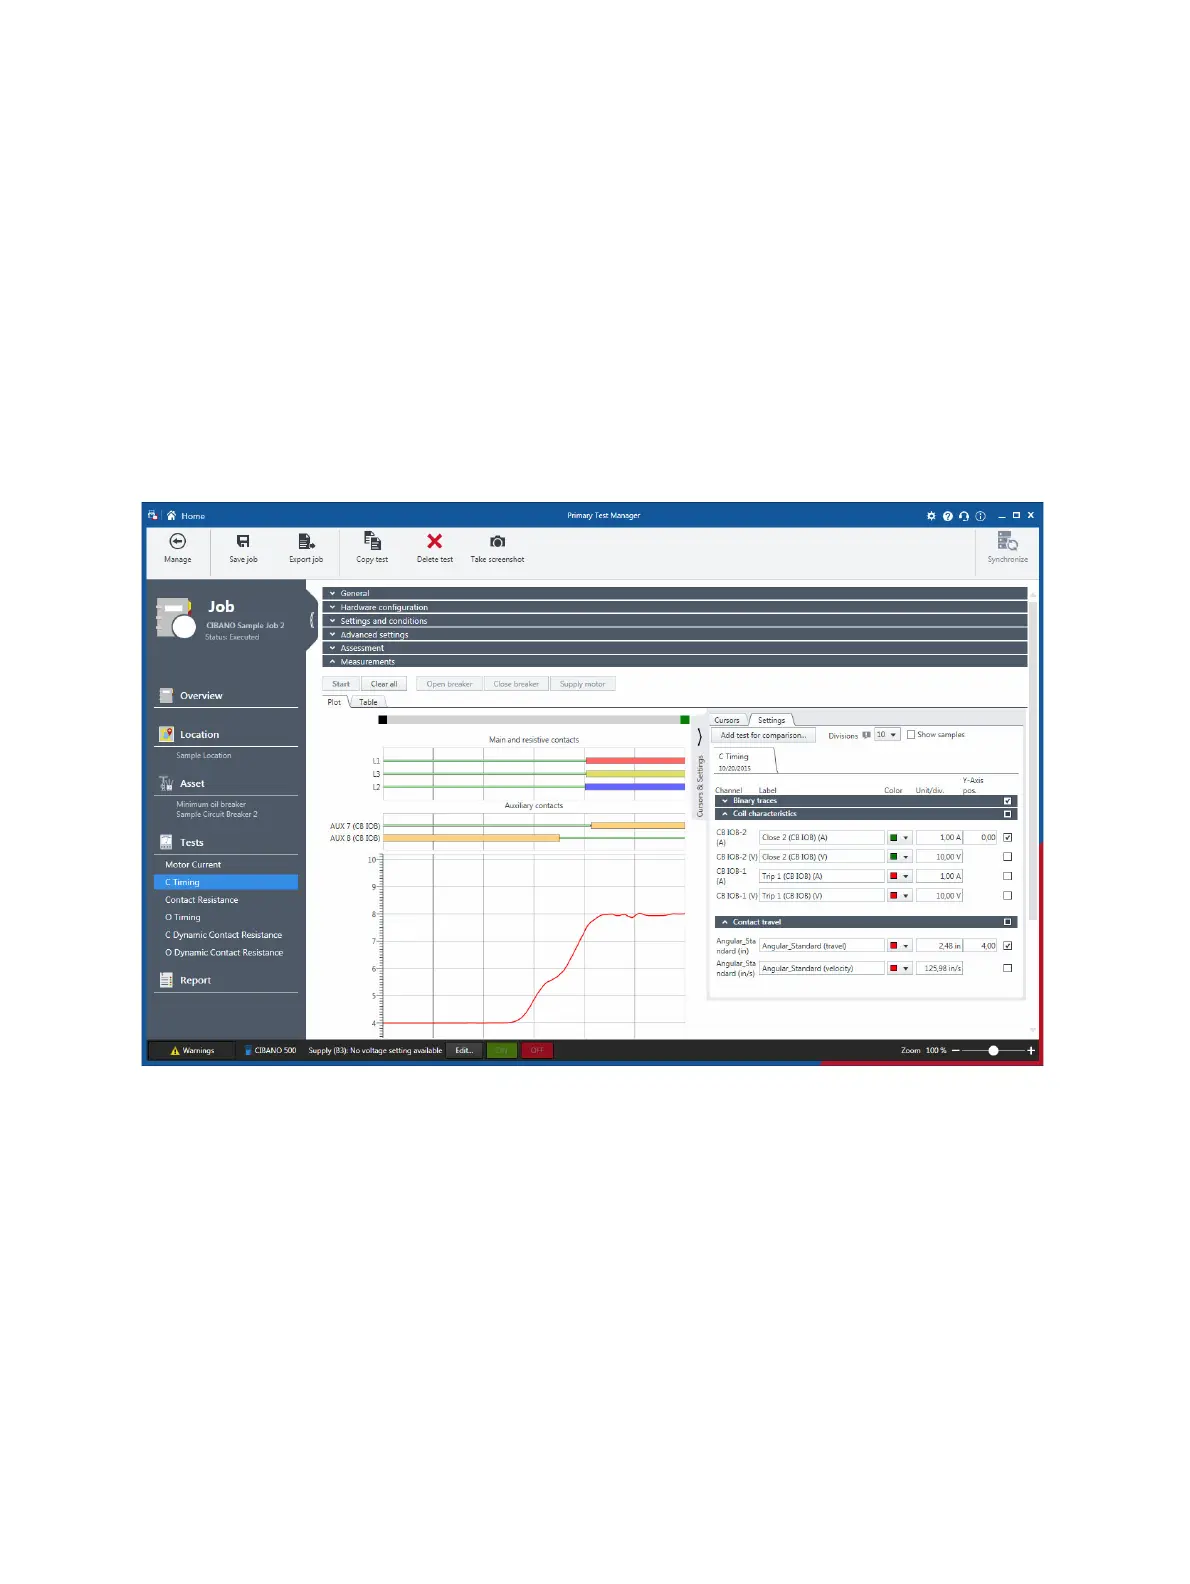
12.2 Graphical comparison
Note: Graphical comparison is available only in the guided workflow.
With Primary Test Manager, you can visually compare up to ten measurement results. A typical use case
is to compare the latest measurement results with a previous measurement at the same circuit breaker.
To compare the measurement results:
1. In Primary Test Manager, open the test you want to compare with other tests.
2. In the Measurements area, click the Plot tab.
3. Expand the Cursors & settings workspace on the right side of the Plot tab, and then click the Settings
tab.
Figure 12-4: Processing the graphical comparison
 Loading...