Viewing ST Maps 7 ECG, Arrhythmia, ST and QT Monitoring
133
2
Select the alarm to be adjusted.
3 Select the appropriate setting.
Viewing ST Maps
The monitor can derive a multi-axis portrait (map) from the ST analysis to help you detect changes in
ST values. It displays two planes obtained from a multilead ECG in a multi-axis diagram, where each
axis represents a lead. The ST value at the J point is given. The position of the axes within the diagram
correspond to the placement of the ECG leads. Each ST value is assigned to either a limb lead, or to a
chest lead. Every axis shows the polarity of the lead it represents. By joining adjacent ST values, the
monitor obtains the ST map. The contour line, and the map shading, is shown in the same color as the
ECG parameter.
Current View
In current view, the monitor displays an ST map that corresponds to the current ST values. Three or
more leads per plane are necessary to display a map.
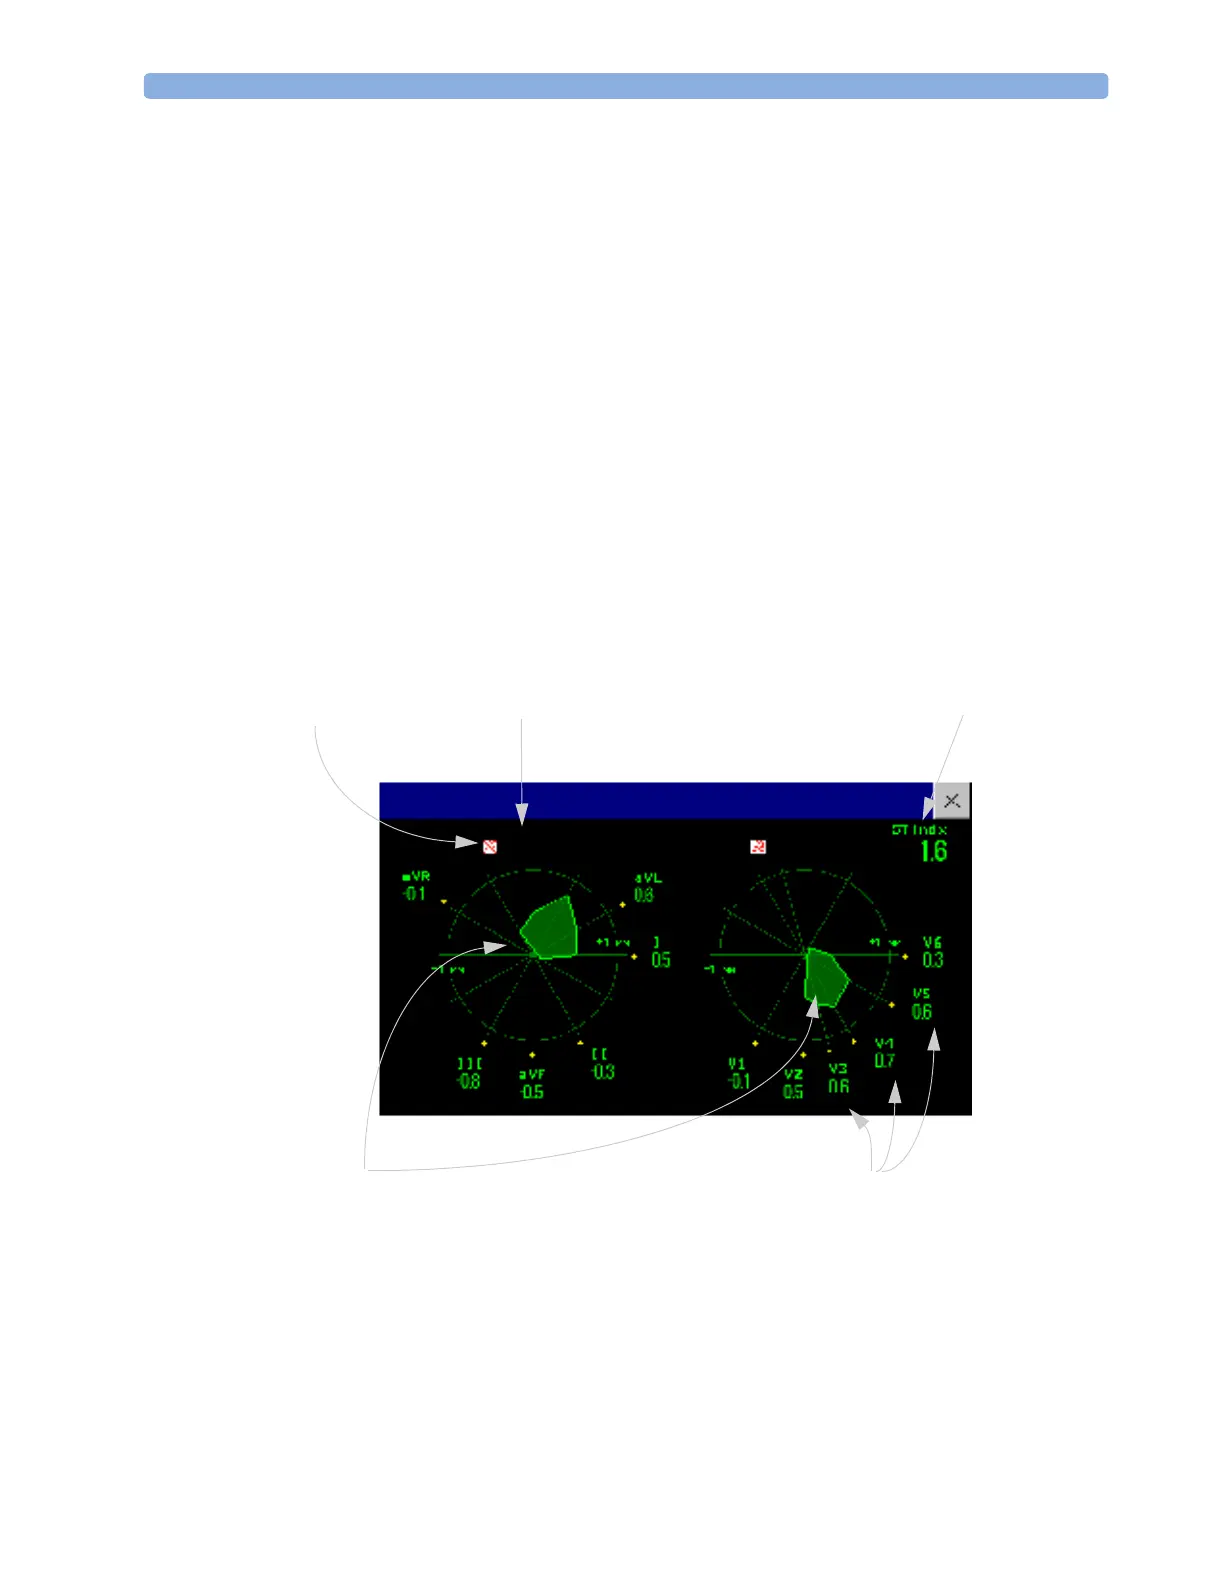
The left of the following diagram shows leads I, II, III, aVR, aVL, and aVF on the limb leads. On the
right, the V-leads (V1, V2, V3, V4, V5, and V6) are on the chest leads.
-
ST map
ST index (for EASI)12-Lead EASI indicator
alarm status indicator
EASI Limb leads EASI Chest Leads
ST label, value and polarity of corresponding lead
ST Map (Current)
 Loading...