Screen Trends 18 Trends
217
The trend time for tabular screen trends depends on the space available on the Screen. Up to 30
measurements or 12 hours information can be shown.
Histogram View
The histogram view presents a combination of graphical trend and histogram. The histogram is on the
right hand side in a horizontal presentation with vertical gridlines representing 25%, 50%, 75% and
100%. Each column shows the percentage of time that the measurement values were in a specific
range. This range is represented by the column’s position in the graphical trend gridlines. The arrow
mark next to a column shows that the currently measured value is in the range covered by that column.
If less than two-thirds of the samples are valid, the histogram will be replaced by a question mark.
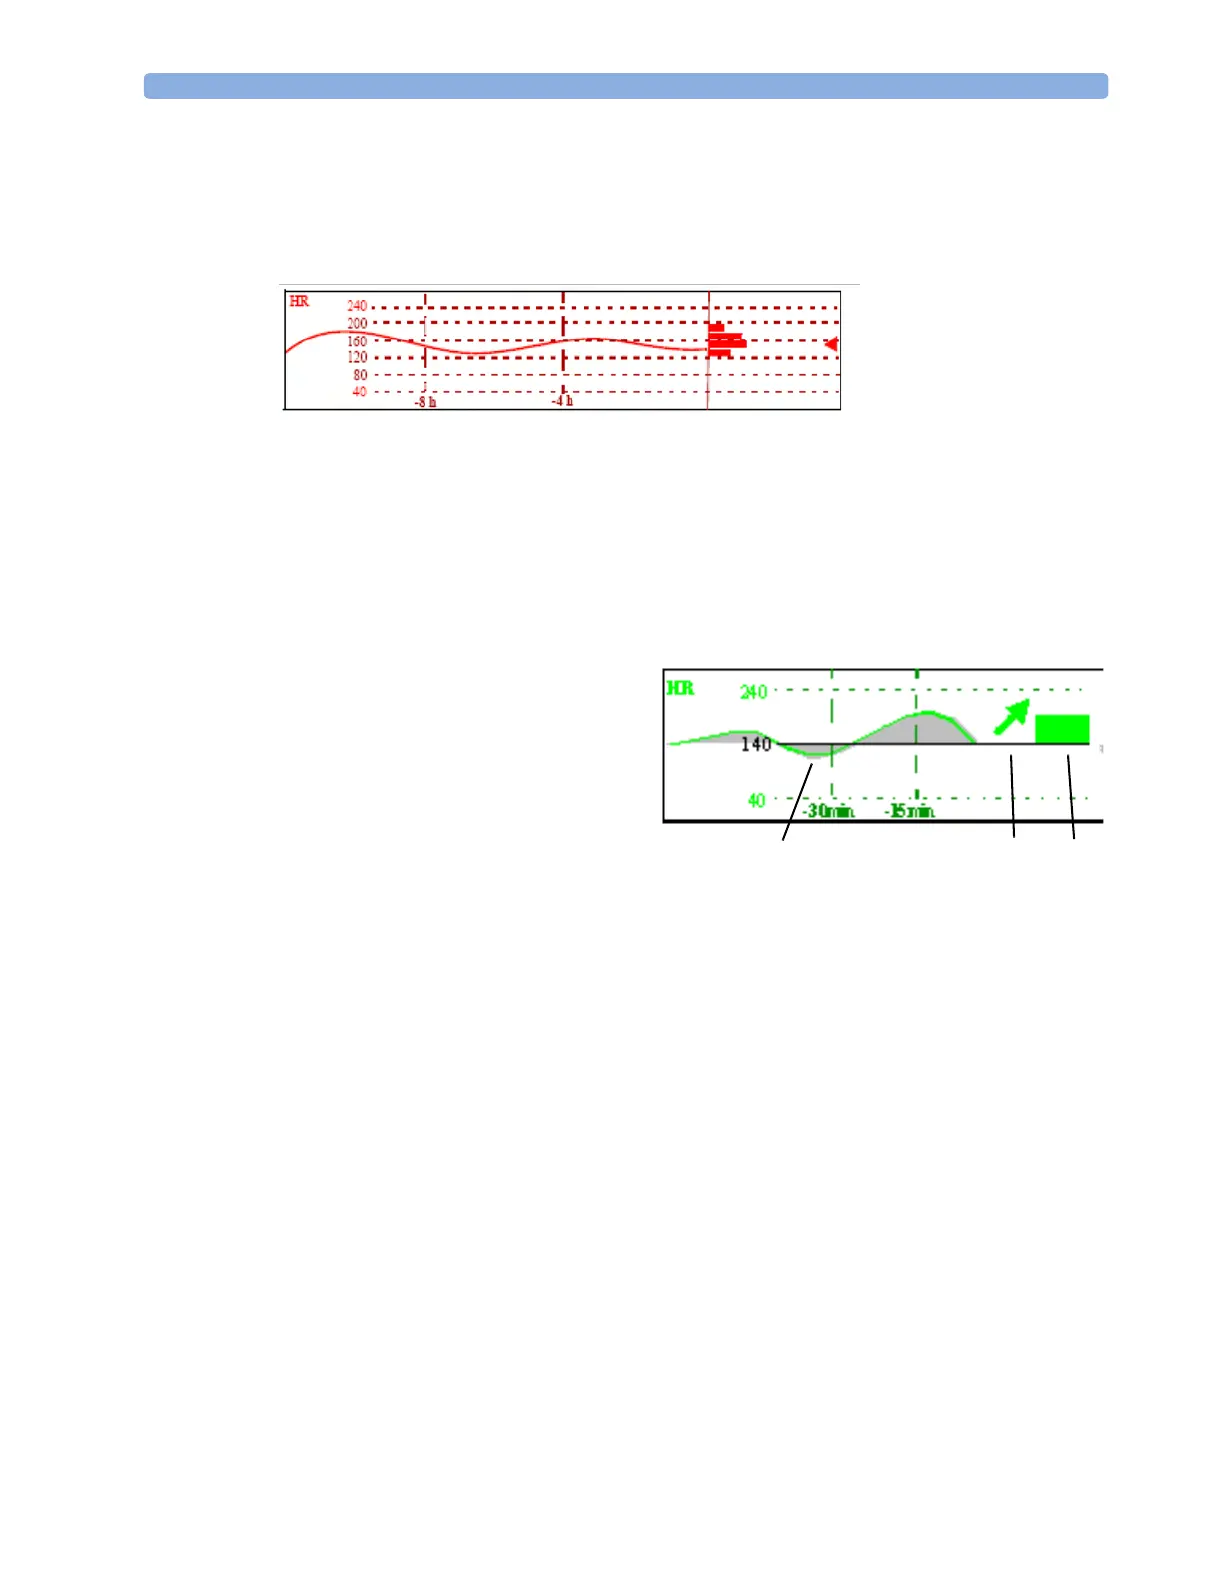
Horizon View
The horizon view presents trend information
superimposed over a defined baseline or base
range. This helps you visualize changes in
your patient’s condition since the baseline
was set.
The horizon view is made up of:
• a horizon, drawn in white, as a reference
point or baseline to help you visualize
changes in your patient’s condition. The horizon can be set to represent your patient’s current
condition, or a target condition and can be a single value or a range.
• a graphical trend, displaying patient data for the set TrendTime (1).
• a trend indicator arrow, indicating how the patient trend has developed in the set time period
(10 minutes, 5 minutes or 2 minutes) (2).
• a deviation bar, showing how the currently measured value deviates from the set horizon (3). The
height of the deviation bar is an indication of the extent of the change in your patient’s condition
relative to the (horizon) baseline.
Your monitor may not be configured to show all elements of the screen trend horizon view.
Setting the Horizon
The horizon is the reference value to which deviations in the measurements are compared.
1 To set the horizon, select the horizon trend
2 Select
– Set High Horizon to select the upper horizon value. If the high and low horizon values are
the same, the horizon is a baseline - if the values are different the horizon is a range.
– Set Low Horizon to select the lower horizon value.
123
 Loading...