207
18
18Trends
Trends are patient data collected over time and displayed in graphic, tabular or histogram form to give
you a picture of how your patient’s condition is developing. Trend information is stored in the trends
database for continuously-monitored measurements, such as ECG, as well as for aperiodically-
measured parameters, such as Cardiac Output.
Viewing Trends
Trend information can be viewed embedded as a screen element on specially-designed Screens, or you
can open a trend window over the current Screen.
♦ To view trends embedded as a screen element, select the Screen name in the monitor info line to
enter the Change Screen menu, then select a Screen designed to show an embedded trend
window.
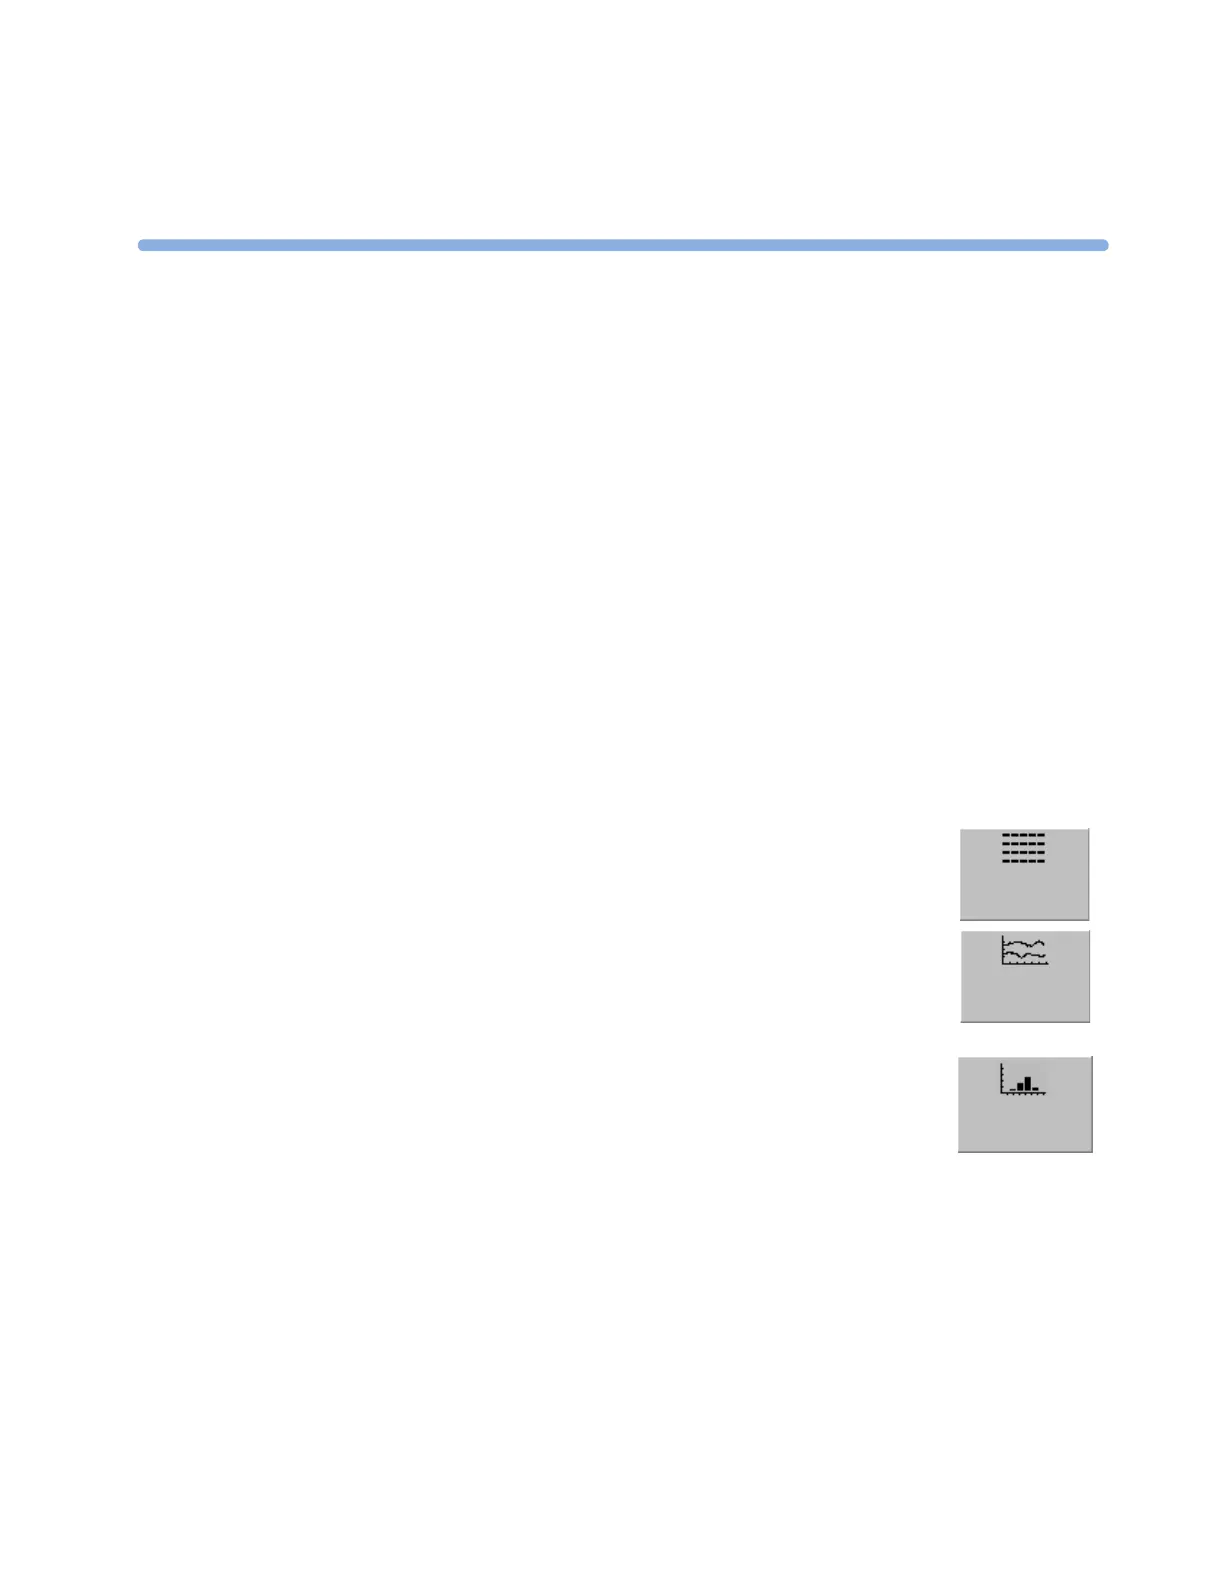
♦ To open the tabular trends window over the current Screen, select the
Vitals Trend
SmartKey.
♦ To open the graphic trends window over the current Screen, select the
Graph Trend SmartKey.
♦ To open the graphic trends window over the current screen, select Main
Setup > Trends > Graph Trend.
♦ To open the histogram trend window over the current screen, select Main
Setup > Trends > Histogram, or select the Histogram SmartKey. .
The trend windows open displaying the most recent data and are updated as new
data is stored. A timescale along the bottom of the screen shows you where you
are in the trends database. The preview column on the right-hand side shows the
latest available measurement value. The preview column is updated every five minutes or whenever an
NBP or other aperiodic measurement is completed.
A question mark (?) beside a value means that the data may not be reliable, due perhaps to an INOP
condition in the measurement.
Your monitor screen may look slightly different to the examples shown in this chapter.
Vitals
Trend
Graph
Trend
Histo-
gram
 Loading...