Viewing Trends 18 Trends
209
A cursor spanning all measurements in the trend group helps you to navigate through the trends
database and shows you your current position in the database. When the cursor is moved across the
time line, the values measured at the cursor time are shown in the right hand column.
In graphical trends, aperiodic measurement trends are shown as an asterisk, NBP has a special symbol.
To use the trend cursor to navigate in time through the trends database,
1 Select the graphical trend or the arrow pop-up keys to activate the cursor.
2 Use the arrow pop-up keys to move the trend cursor backwards and forwards in time, or
3 Place the cursor at a specific time by touching the graph.
Viewing Vital Signs Trends
The currently-selected column is highlighted. The values can be configured to display in the same
colors as the waves and numerics on the realtime display.
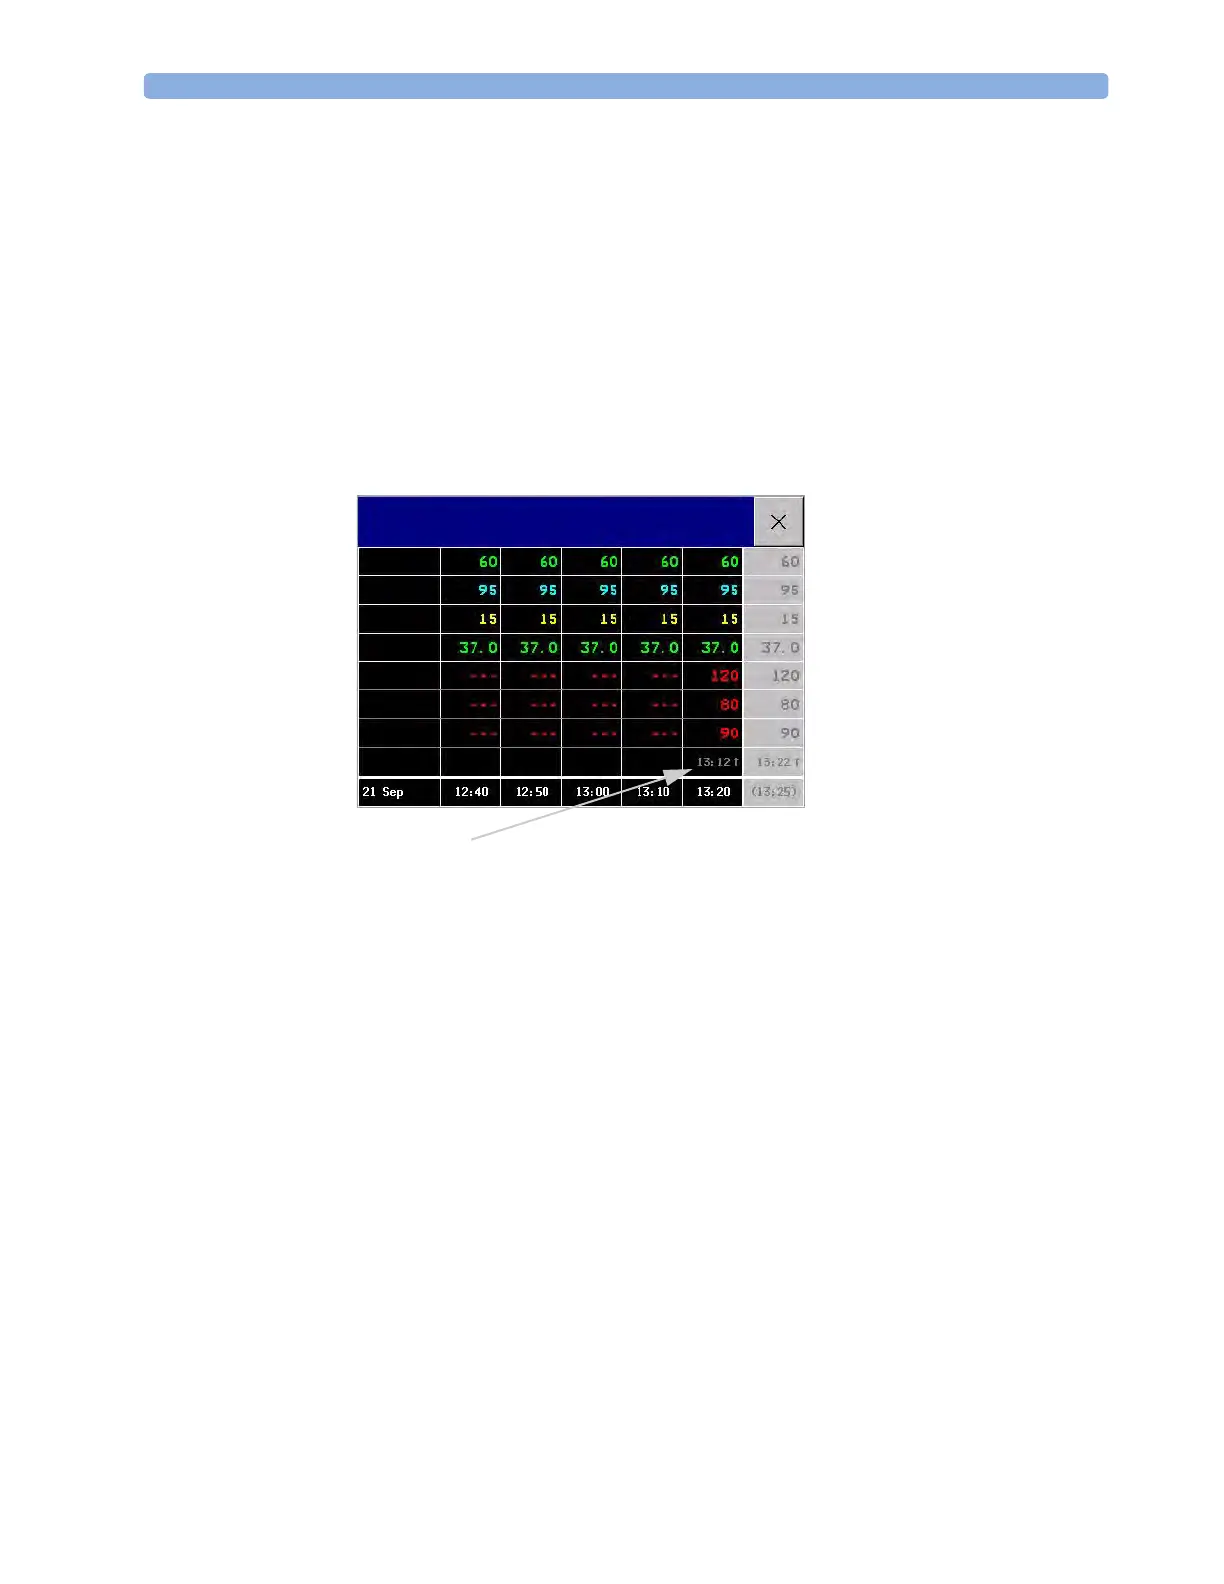
Any values available for display before the next scheduled update are shown in the right hand column,
with a timestamp in brackets.
If more than one value is available for an aperiodic trend for a certain trend period, all measured values
are stored in the database and the value closest to the timestamp is shown in the Vital Signs display
marked with an arrow.
Vital Signs: Standard
HR
SpO
2
RR
Temp
NBPs
NBPd
NBPm
Aperiodic values are shown with a timestamp
 Loading...