15-16 Calculations Rexroth IndraDrive
DOK-INDRV*-SYSTEM*****-PR02-EN-P
15.5 Calculations for Determining the Allowed Operating Data
of Mains Filters
Reducing Allowed Operating Voltage Depending on Actual Temperature
Rise due to Harmonics
The mains filters may only be operated in the allowed mains voltage
range. Harmonics (f
n
) at the system voltage cause additional temperature
rise of the dielectric of the capacitors used in the filter. Temperature rise
can be calculated according to the following formula:
()
()
[]
K
U
Ux10
T
2
Gn
2
Mn
n
=∆
U
Mn
: measured voltage value at frequency f
n
(harmonic)
U
Gn
: voltage limit value for frequency f
n
∆T
n
: calculated temperature rise of the dielectric for frequency f
n
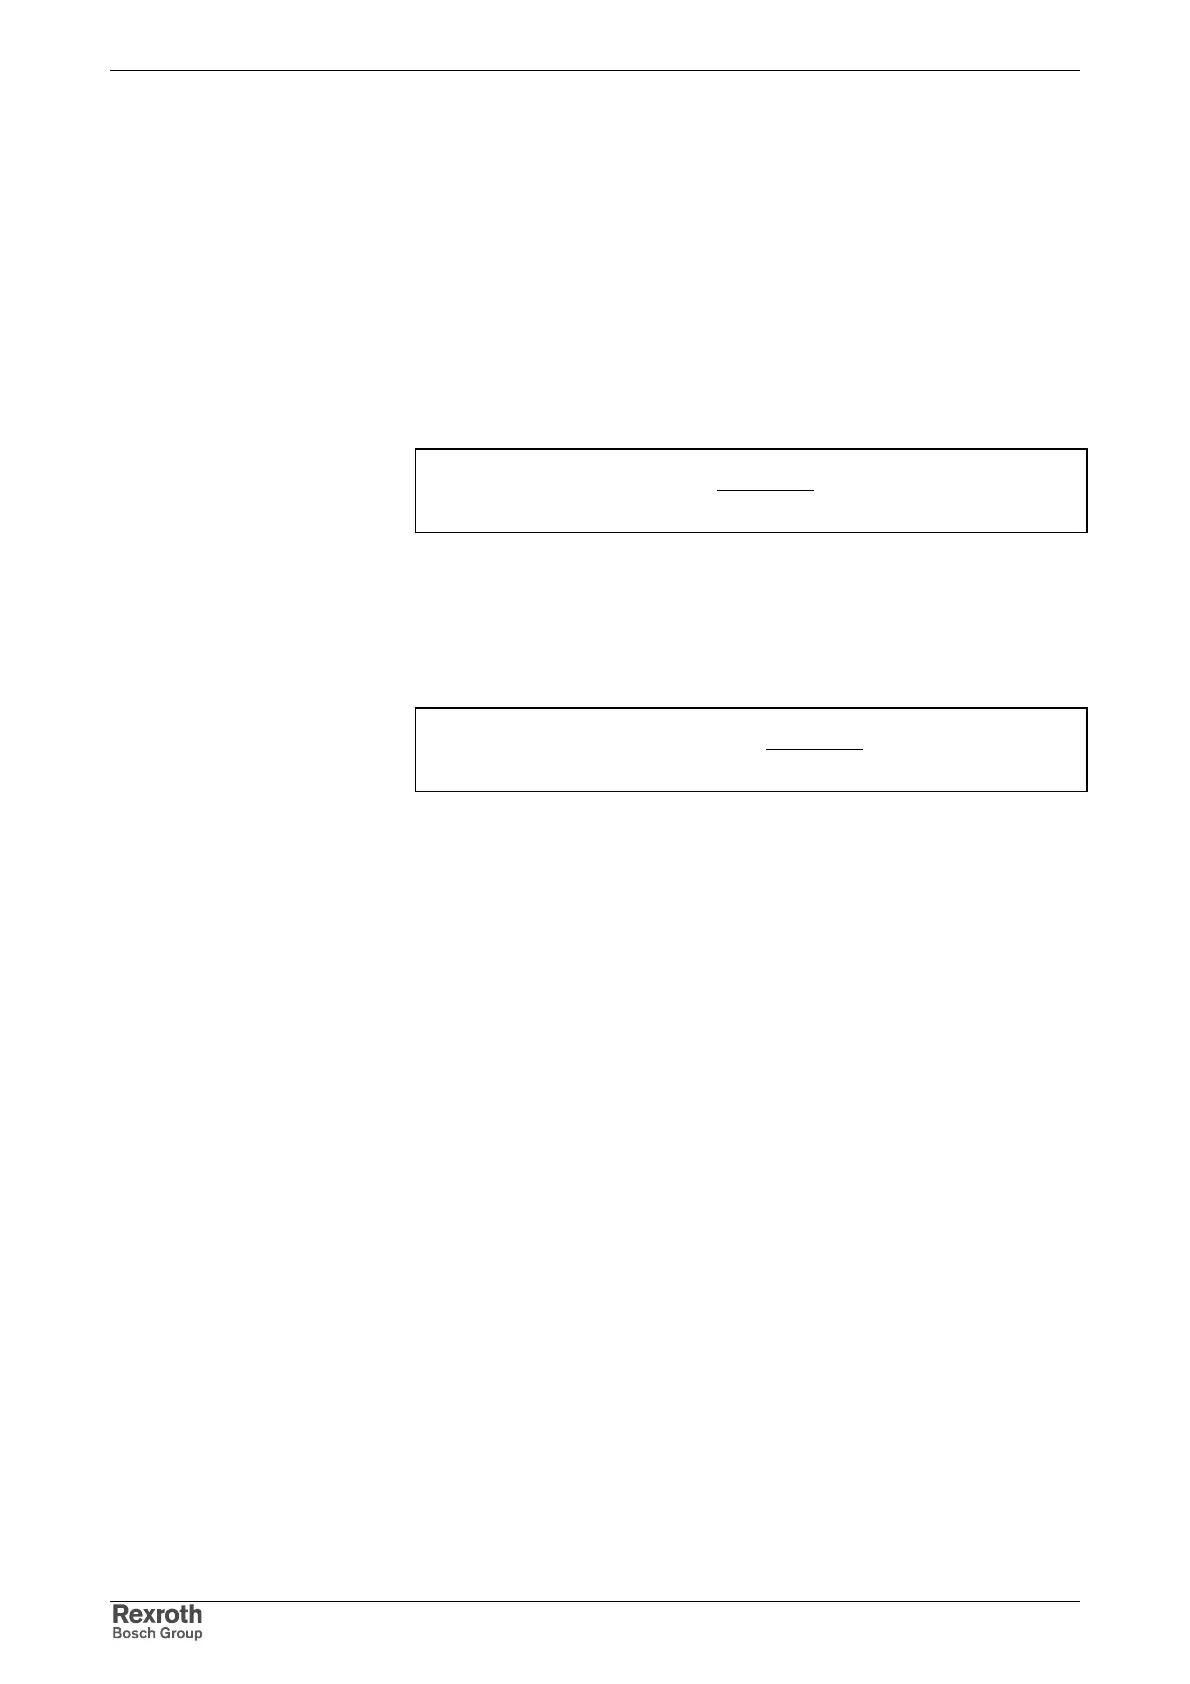
Fig. 15-41: Calculating the temperature rise of the dielectric
The temperature rises have to be added up for all frequencies f
n
≥ f
k
(f
k
:
frequency at which the voltage derating of the filter starts; see Fig. 15-43):
()
()
[] []
K10K
U
Ux10
TT
2
Gv
2
Mv
m
1v
m
1v
vges
≤=∆=∆
∑∑
==
U
Mv
: voltage value at frequency f
v
U
Gv
: voltage limit value for frequency f
v
∆T
ges
: calculated temperature rise of the dielectric for all frequencies
Fig. 15-42: Calculating the temperature rise of the dielectric for all frequencies
By means of the above formulas and the measured voltages it is possible
to determine the real load of a filter with voltages of higher frequencies.
To this end, the rms value of the voltage on the mains side of the filter
with all occurring frequencies (higher than f
k
) must be measured by
means of a Fourier analysis for all combinations of line/line and line/PE.
You always have to measure the voltages under conditions of operation at
the nominal working point, the filter having been installed. By means of
the measured values it is then possible to calculate the temperature rise.
To do this, the limit values of the following diagram are read at the
respective frequency and used in the formula together with the measured
value.