SVAN 948 USER MANUAL .
4 - 60
In order to change the mode of the measurement results presentation the user has to press the
<
> or the <
> push-buttons. The following modes are available:
One profile, SPECTRUM, 3 PROFILES, STATISTICS and PLOT.
Notice: The user can select the number of the currently active modes of the
measurement results presentation switching on ([
√
√√
√
]) or off ([ ]) the given mode in the DISPLAY sub-list
of the DISPLAY list. Only one profile mode cannot be switched off. See Chapter 5 for the details about
the display modes control.
One Profile, 3 PROFILES, STATISTICS and PLOT display modes are identical as for the SLM.
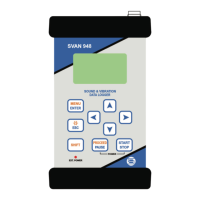
The SPECTRUM mode displays 1/3 OCTAVE analysis results (so-called spectrum) together with the
TOTAL RMS values measured with A, C and LIN weighting filters. The read-out of the interested
spectrum value can be done by means of the cursor controlled by the <
>, <
> push-buttons. On the
right side of the display the selected 1/3 octave filter centre frequency (or the selected TOTAL) is given,
the units with the weighting filter (dB A, dB C or dB in the case of the LIN) and the numerical value are
displayed.
The view of the displays in 1/3 OCTAVE analysis in the SPECTRUM display mode for CHANNEL 1
In one profile and 3 PROFILES modes the results are presented in the same way as in the case of
the SLM mode with only one difference that instead of the continuous line the doted one is used. The
active channel is changed after each pressing of the <
>, <
> push-buttons. The change of the result
from the same channel is done by pressing the <
>, <
> push-buttons. The LN value is changed after
pressing the <SHIFT> and <
> or <SHIFT> and <
> push-buttons.
The view of the displays in 1/3 OCTAVE analysis in one profile and 3 PROFILES modes of result’s
presentation
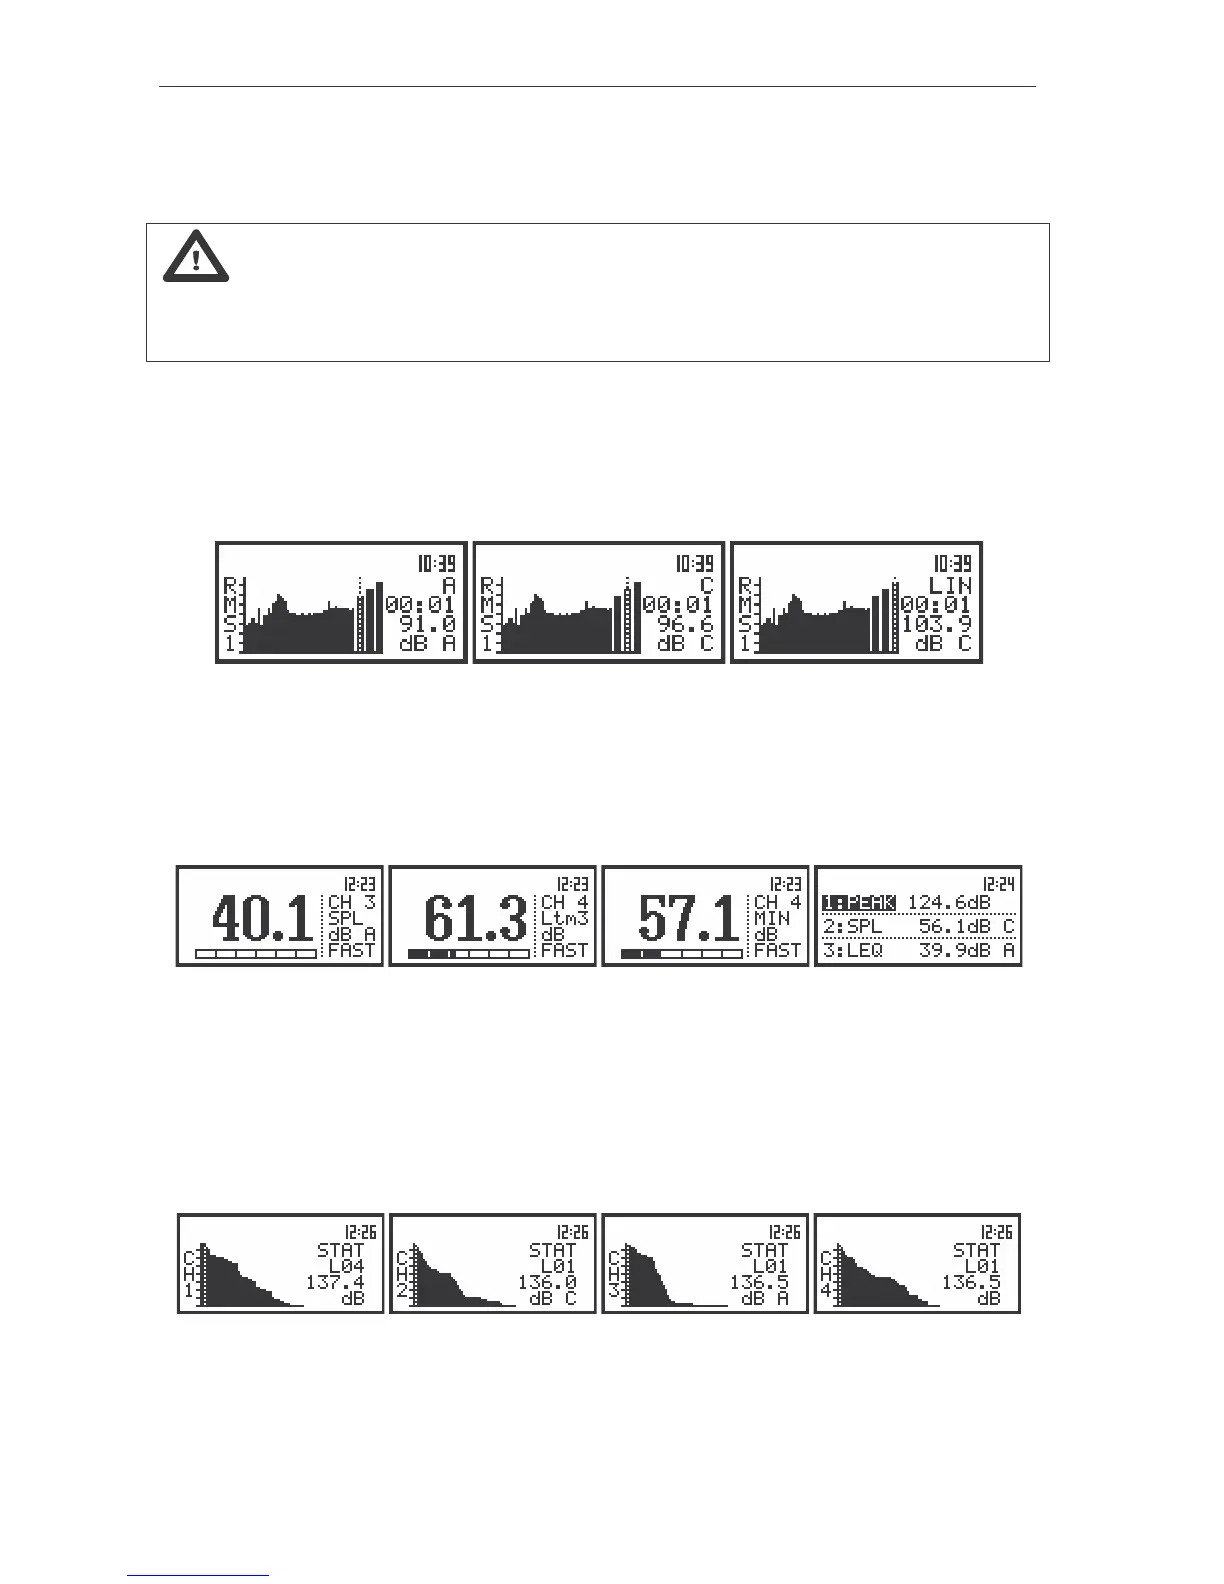
In the STATISTICS mode it is possible to select the LN value using the <
>, <
> push-buttons.
The active channel is presented on the left side of the display. LN corresponding to the current position of
the cursor is displayed in the second line of the right sight of the display, value of LN - in the third line and
the units together with the indicator of the weighting filter - in the fourth. When the STATISTICS mode of
result’s presentation is entered (<SHIFT> and <
> or <SHIFT> and <
> push-buttons are used for this
purpose) in order to change the active channel the <
>, <
> push-buttons should be pressed.
The view of the displays in 1/3 OCTAVE analysis with presentation of the statistical analysis in all channels
In the PLOT mode the results are presented which are saved in the buffer from the channels (in
case when text ON in the BUFFERS positions is selected) and user selects in the CHANNEL x sub-lists