SVAN 948 USER MANUAL
4 - 61
position to display in PLOT mode (user can switched on ([√
√√
√] selected position to display in PLOT mode)
with the step set for all channels in the BUF. STEP position. The active channel is changed after pressing
the <
> and <
> push-buttons. The position of the cursor can be done after pressing the <
>, <
>
push-buttons. It is also possible to shift the horizontal axis in relation to the vertical one of the presented
results using the <SHIFT> and <
> or <SHIFT> and <
> push-buttons (similarly as in the SPECTRUM
mode).
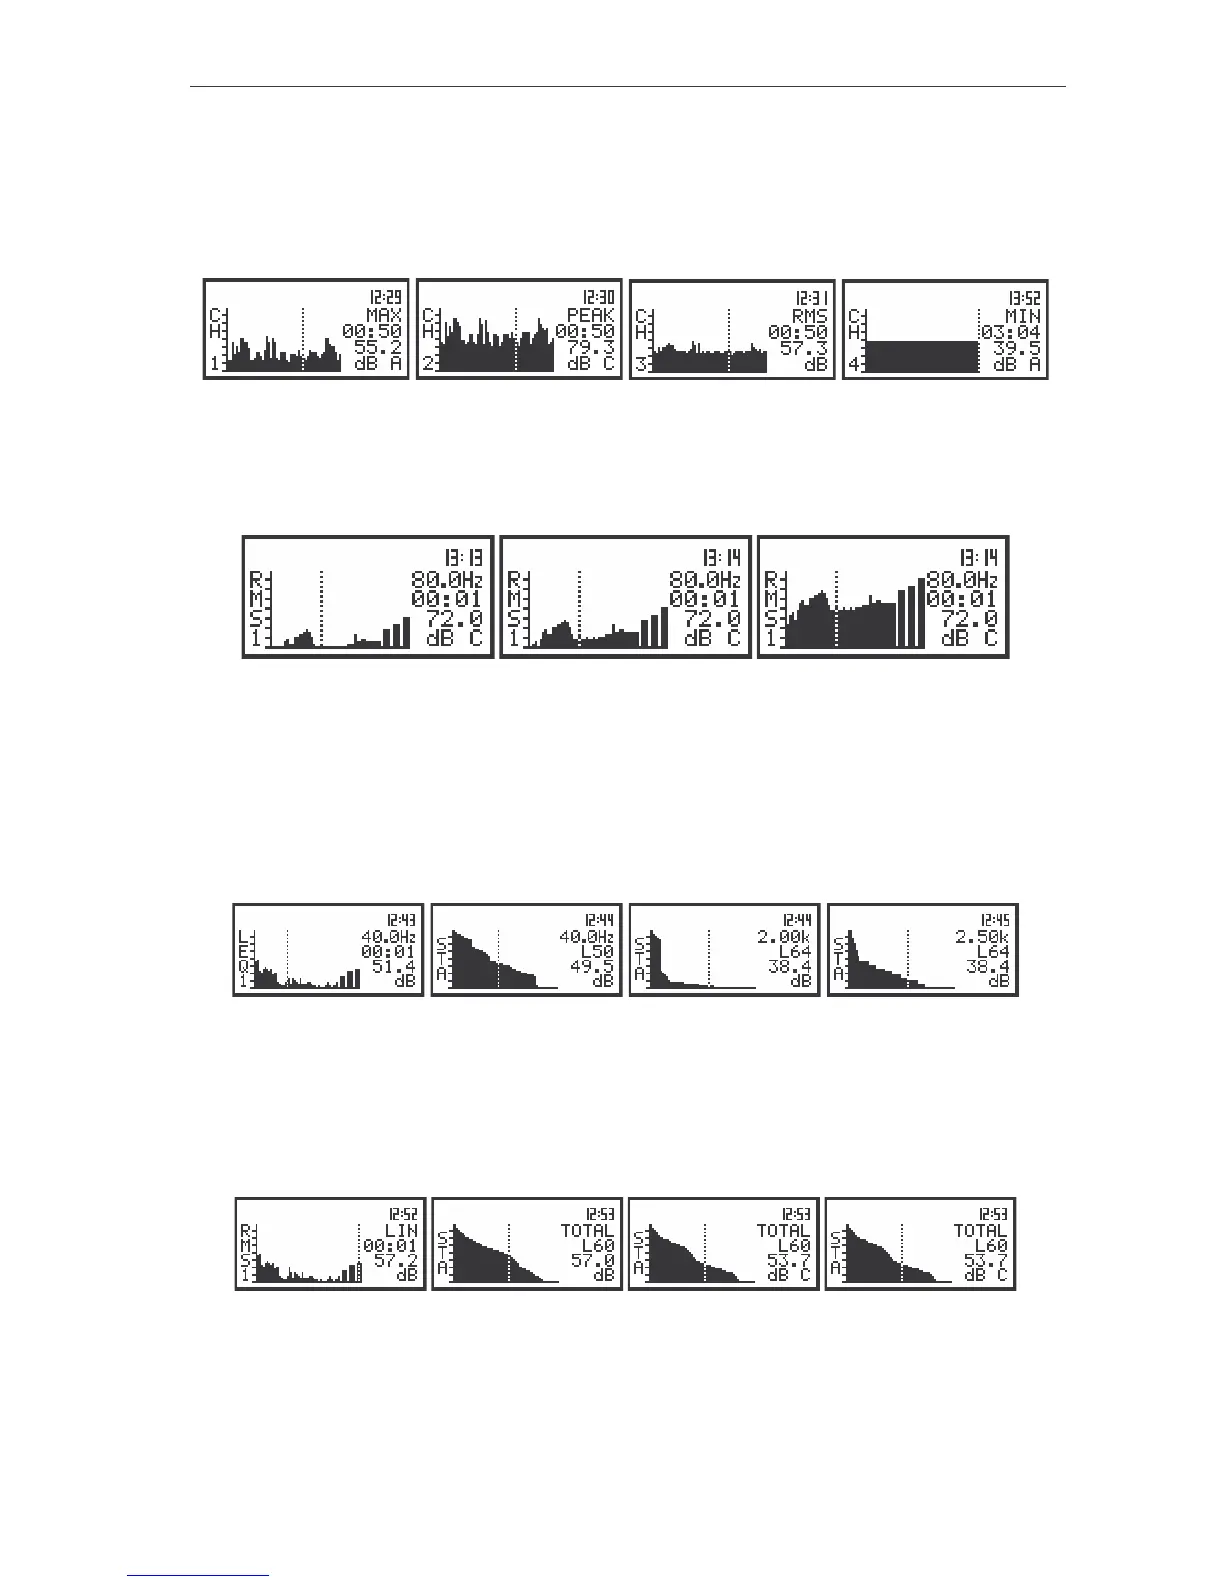
The view of the displays in 1/3 OCTAVE analysis in the PLOT mode; the registered results from all channels
In the SPECTRUM mode it is possible to shift the horizontal axis in relation to the vertical one of the
presented results using the <SHIFT> and <
> or <SHIFT> and <
> push-buttons. After each pressing
of these buttons the presented picture moves 10 dB down or up - respectively.
The view of the displays in 1/3 OCTAVE analysis with the shifted horizontal axis in relation to vertical one
The statistical analysis is also performed in 1/3 OCTAVE analysis. The results of this analysis are
presented on the display after pressing the <ENTER> push-button in the case when the instrument is in
the SPECTRUM mode of result’s presentation. After this pressing the statistical analysis performed for the
selected 1/3 OCTAVE filter is shown on the display. The centre frequency of the filter for which the
analysis was made, the LN number corresponding to the cursor position, the LN value and the units are
presented on the right side of the display. The LN value can be changed by pressing the <
>, <
> push-
buttons.
The view of the displays in SPECTRUM mode and after entering the presentation of the statistical analysis
results performed for each 1/3 OCTAVE filter
The selection of 1/3 OCTAVE filter is performed after pressing the <
> or <
> push-buttons. The
statistical analysis is also made for all TOTAL values of 1/3 OCTAVE analysis. The <ESC> push-button
has to be pressed in order to leave the presentation of the statistical analysis performed in 1/3 OCTAVE
analysis and return to the SPECTRUM mode of result’s presentation.
The view of the displays in the presentation of the statistical analysis results performed for TOTAL results of
1/3 OCTAVE analysis
The spectra registered in the buffer’s file can be presented on the display in the BUFFER VIEW
sub-list of the DISPLAY list path: MENU / DISPLAY / BUFFER VIEW). These spectra are saved with the