X35 Console Monitoring & Managing Files
10.2
10.1 Viewing Information On The Dashboard
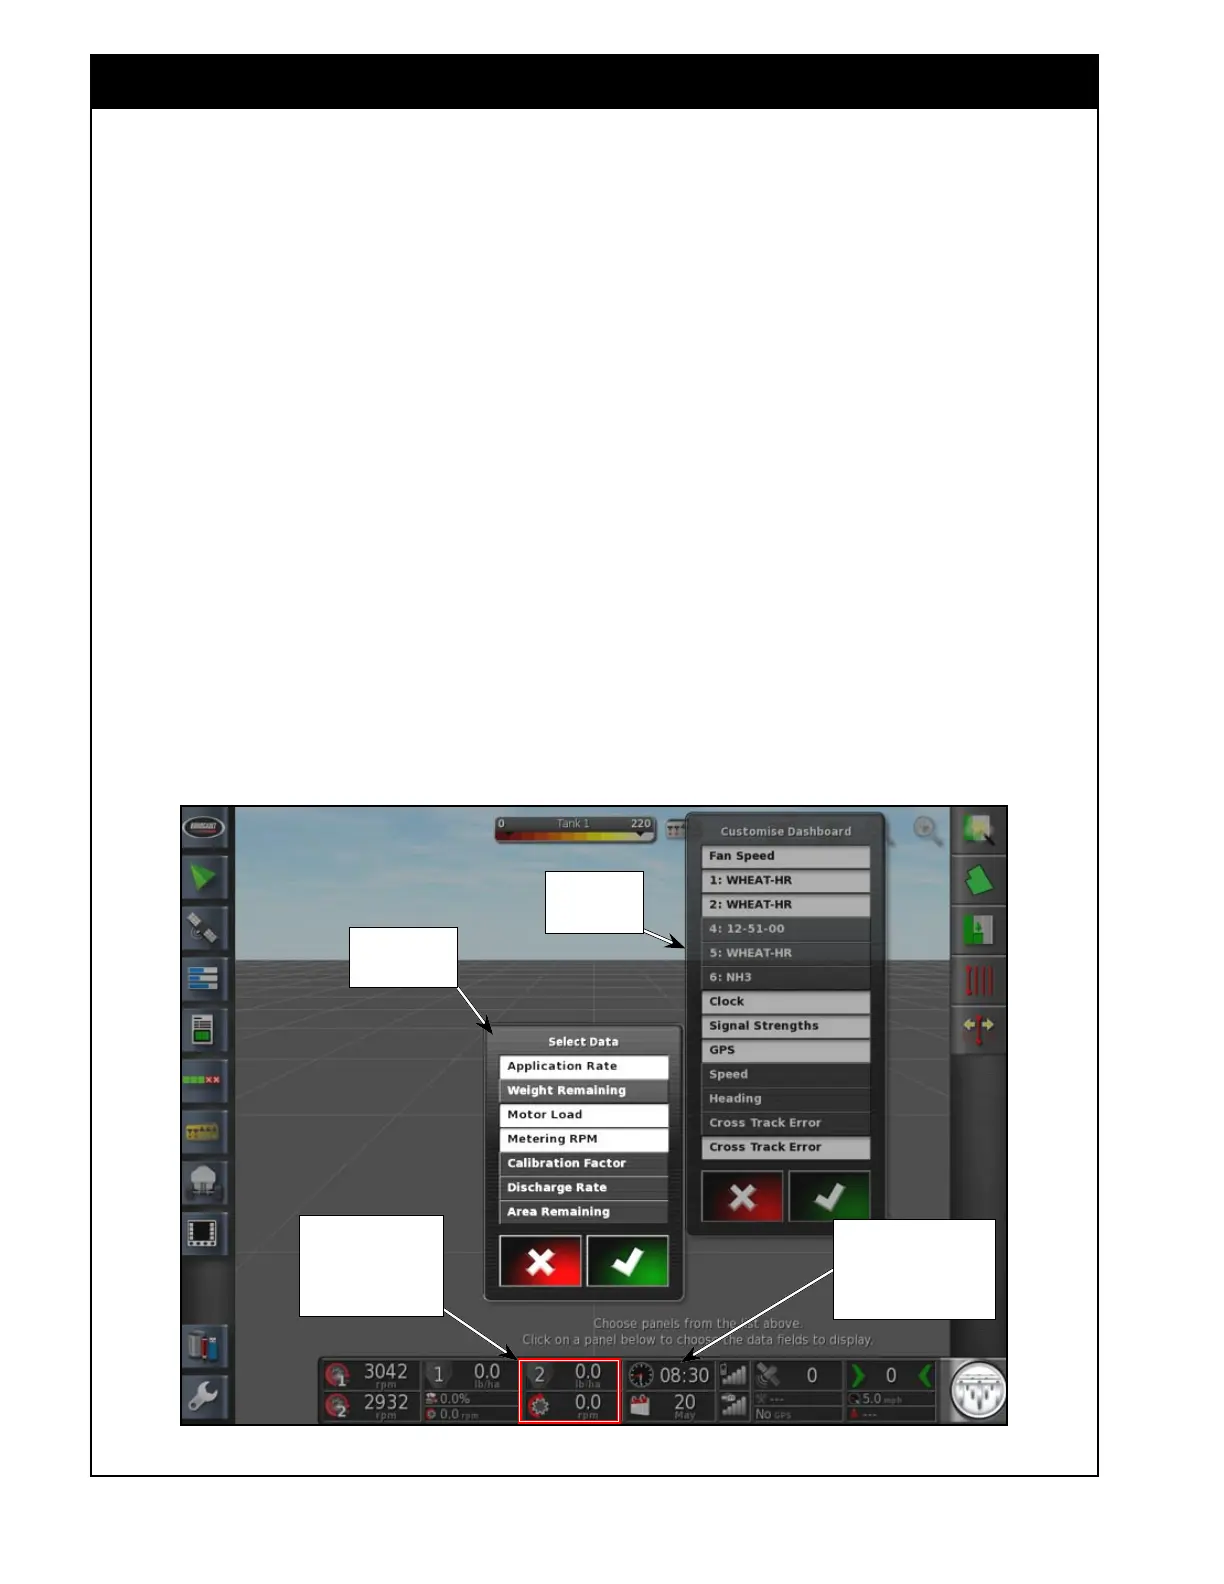
Figure 10.1 - Dashboard
Select anywhere on the
Dashboard to bring up the
"Customize Dashboard"
window
10.1.1 Configuring the Dashboard
The Dashboard is located at the bottom of the
operational screen. It can be customized to display
desired information.
Refer to
Figure 10.1.
1. Select anywhere on the Dashboard to bring up
the Customize Dashboard window. A list of
available information will be shown on display
panels.
2. Chosen options in the list will appear with a
white background.
a. Only enabled tanks will appear in the list.
i. For example, tank #3 is disabled and
product from this tank is redirected
to tank #2 for metering.
3. Choose the options to be displayed.
a. Chosen data will have a white background.
Customize
Dashboard
window
Select anywhere on
the Tank #2 panel to
bring up list of data to
customize it.
window to
customize tank
#2 panel
b. Confirm the new Dashboard display.
c. Selected panels will appear on the
dashboard.
4. Each panel on the dashboard can also be
customized to display certain information.
a. Select anywhere on the Dashboard to bring
up the Customize Dashboard window.
b. While the Customize Dashboard window
is open select the panel to be customized
(touch the panel on the Dashboard).
c. A new window with the list of data for
display will appear. Refer to Figure 10.1
for an example of customizing the granular
tanks panels.
5. Choose information to be displayed on that
panel and confirm.
a. Confirm the new Dashboard display.
b. Selected items for the configured panel will
appear on the dashboard.