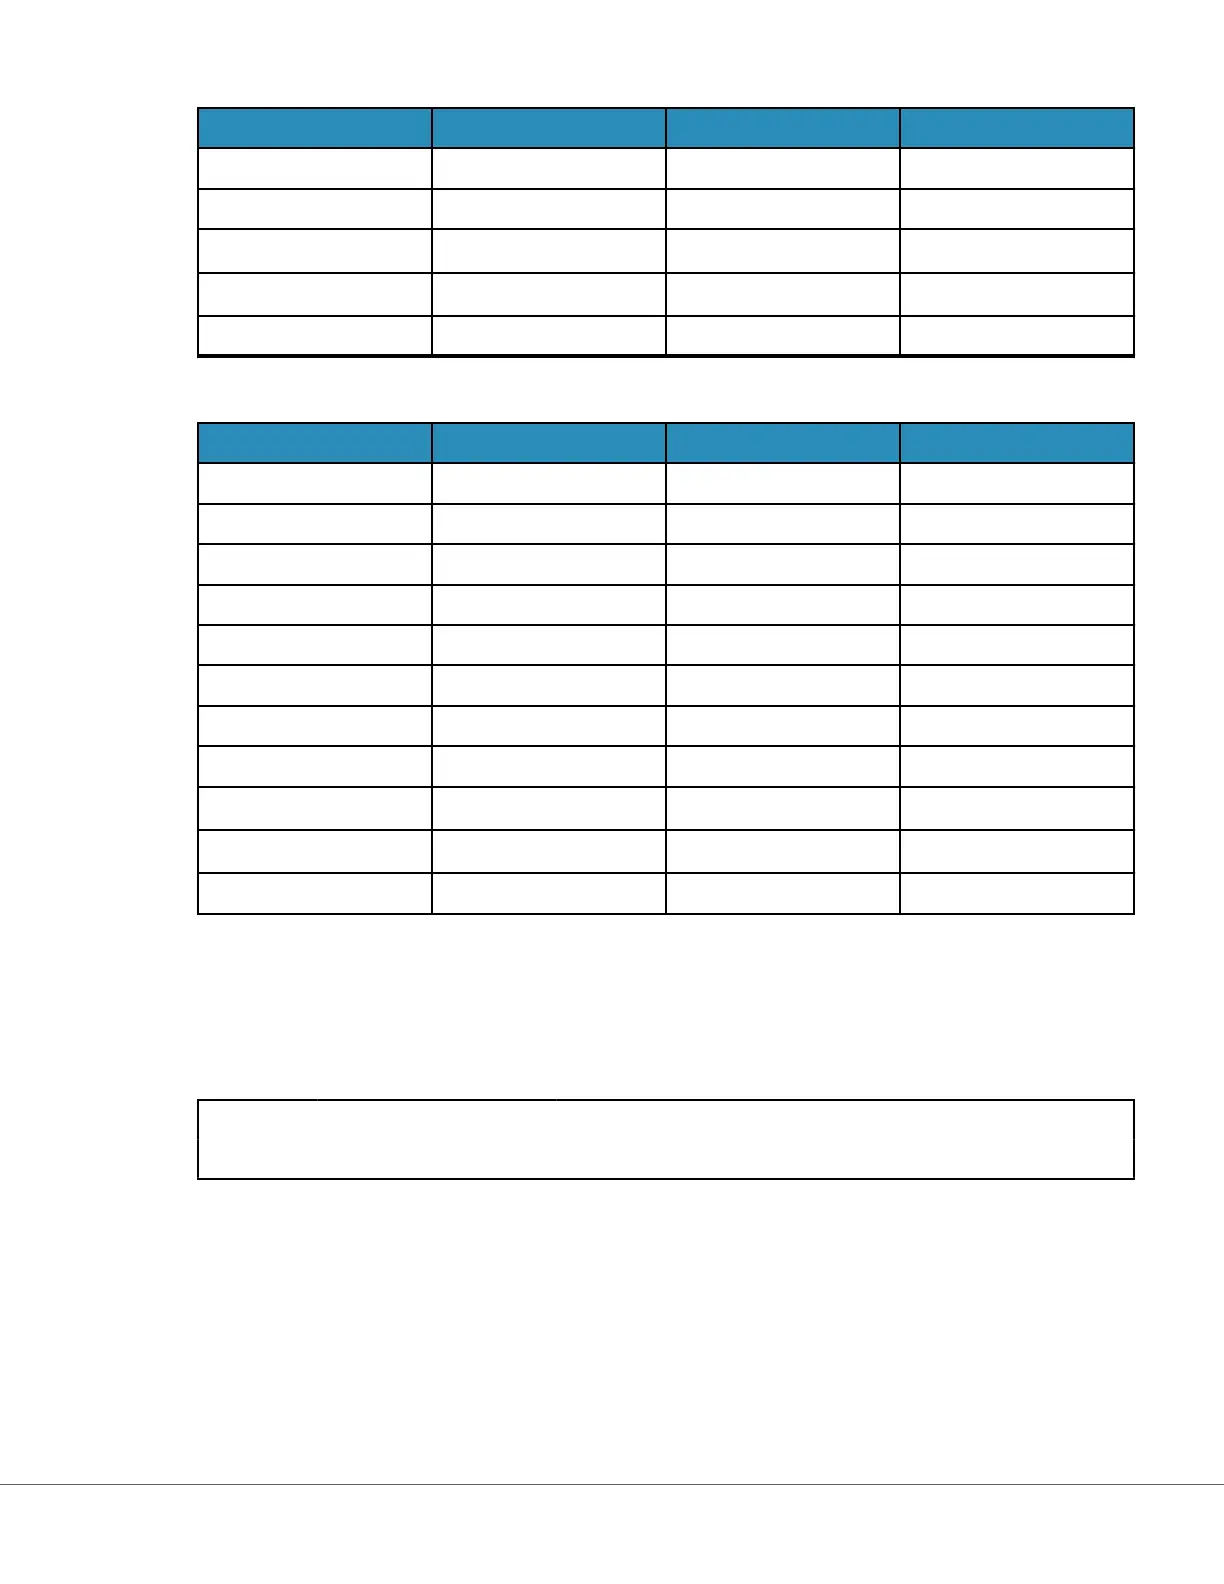
Analyte Control Level 1 Control Level 2 Control Level 3
Lac (mmol/L) 8.4 2.3 1
Crea (µmol/L) 386 155 46
PCO
2
(mmHg) 66 30 22
PO
2
(mmHg) 61 100 140
H+ (pH) 7.15 7.41 7.60
Reacve Ingredients for i-STAT TriControls Control Soluons:
Analyte Control Level 1 Control Level 2 Control Level 3
Na (mmol/L) 118 124 150
K (mmol/L) 3.00 4.00 6.30
Cl (mmol/L) 76 94 119
Glu (mg/dL) 285 160 65
Urea (mg/dL) 44 8.4 4.6
iCa (mmol/L) 0.90 1.35 1.58
Lac (mmol/L) 8.30 3.00 1.63
Crea (mg/dL) 4.65 1.59 0.65
PCO
2
(mmHg) 65 40 26
PO
2
(mmHg) 63 120 163
H+ (pH) 7.025 7.390 7.610
Evaluang QC R
esults
Ranges
The following is an example of the mean and range for level 1 control taken from a Value Assignment
Sheet:
Mean Range
Na mmol/L, mEq/L 120 116-125
Na
is the analyte tested, Na (Sodium).
mmol/L, mEQ/L are the units of measurement.
Mean is the mean or average level of sodium (Na).
Range is the acceptable range of sodium (Na) levels.
76
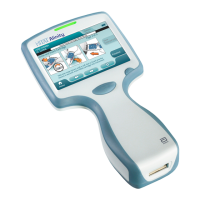
i-STAT Alinity — System Operaons Manual Art: 745533-01 Rev. H Rev. Date: 02-Nov-2022