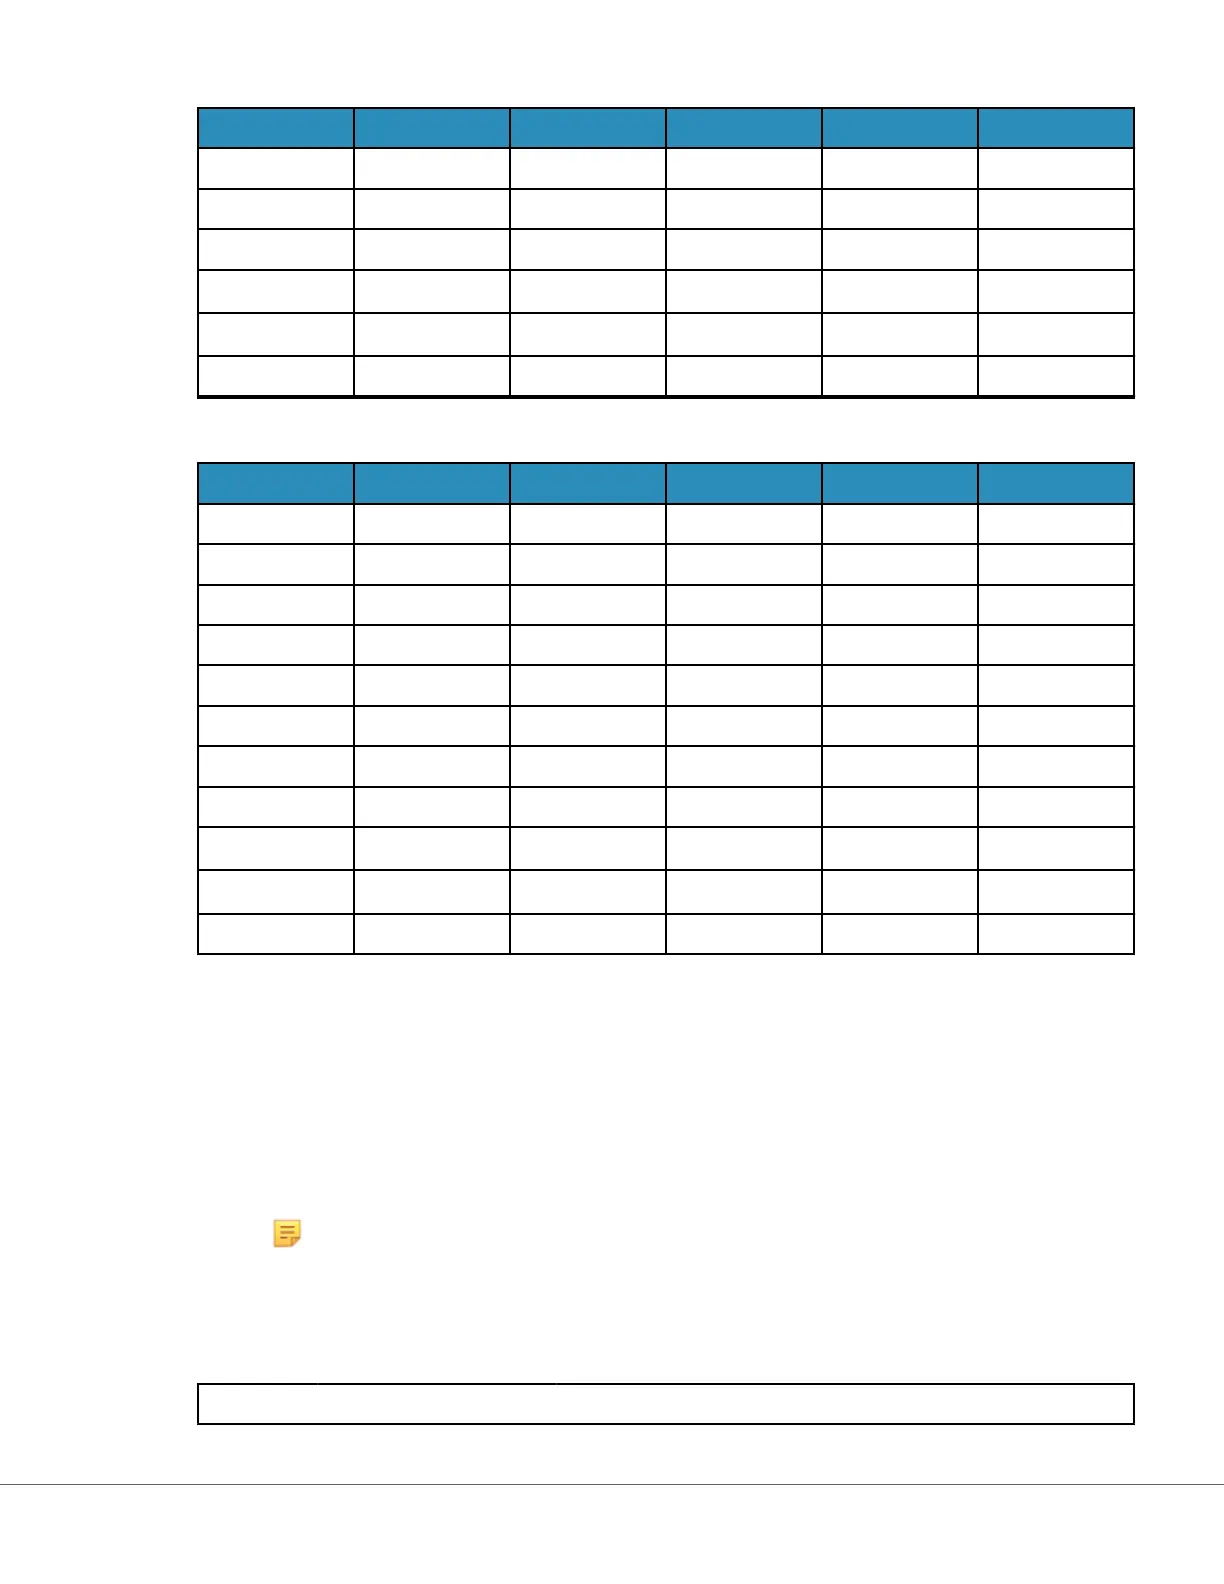
Analyte Cal Ver Level 1 Cal Ver Level 2 Cal Ver Level 3 Cal Ver Level 4 Cal Ver Level 5
iCa (mmol/L) 2.5 1.6 1.3 0.8 0.2
Lac (mmol/L) 19.5 8.4 2.3 1 0.6
Crea (µmol/L) 1486 386 155 46 17
PCO
2
(mmHg) 95 66 30 22 18
PO
2
(mmHg) 43 61 100 140 400
H+ (pH) 6.81 7.15 7.41 7.60 7.95
Reacve ingredients for i-STAT TriControls Calibraon Vericaon materials
Analyte Cal Ver Level 1 Cal Ver Level 2 Cal Ver Level 3 Cal Ver Level 4 Cal Ver Level 5
Na (mmol/L) 97 118 124 150 159
K (mmol/L) 2.30 3.00 4.00 6.30 8.20
Cl (mmol/L) 67 76 94 119 134
Glu (mg/dL) 595 285 160 65 53
Urea (mg/dL) 114 44 8.4 4.6 3.0
iCa (mmol/L) 0.40 0.90 1.35 1.58 2.40
Lac (mmol/L) 17.7 8.30 3.00 1.63 1.52
Crea (mg/dL) 15.6 4.65 1.59 0.65 0.55
PCO
2
(mmHg) 96 65 40 26 12
PO
2
(mmHg) 40 63 120 163 500
H+ (pH) 6.550 7.025 7.390 7.610 7.850
Evaluang Cal Ver Results
Ranges
Calibraon throughout the reportable range of each analyte is veried if each analyte value falls within
the corresponding range in the Value Assignment Sheet.
If a result for a level falls outside the assigned range, follow laboratory policy. Contact Technical Support
for troubleshoong informaon.
Note: If the c
alibraon vericaon set is to be used to assess linearity, plot the analyte
value against the mean value of the acceptable range. The concentraons of analytes in
the calibraon vericaon set are not intended or prepared to be equally spaced.
The following is an example of the mean and range for level 2 Cal Ver soluon t
aken from a Value
Assignment Sheet:
Mean Range
83
i-STAT Alinity — System Operaons Manual Art: 745537-01 Rev. F Rev. Date: 02-Nov-2022
 Loading...
