56 1100 Series FD Reference Manual
2 First Steps with the Fluorescence Detector
6 Wait until the baseline stabilizes. Start the run.
7 Load the signal.
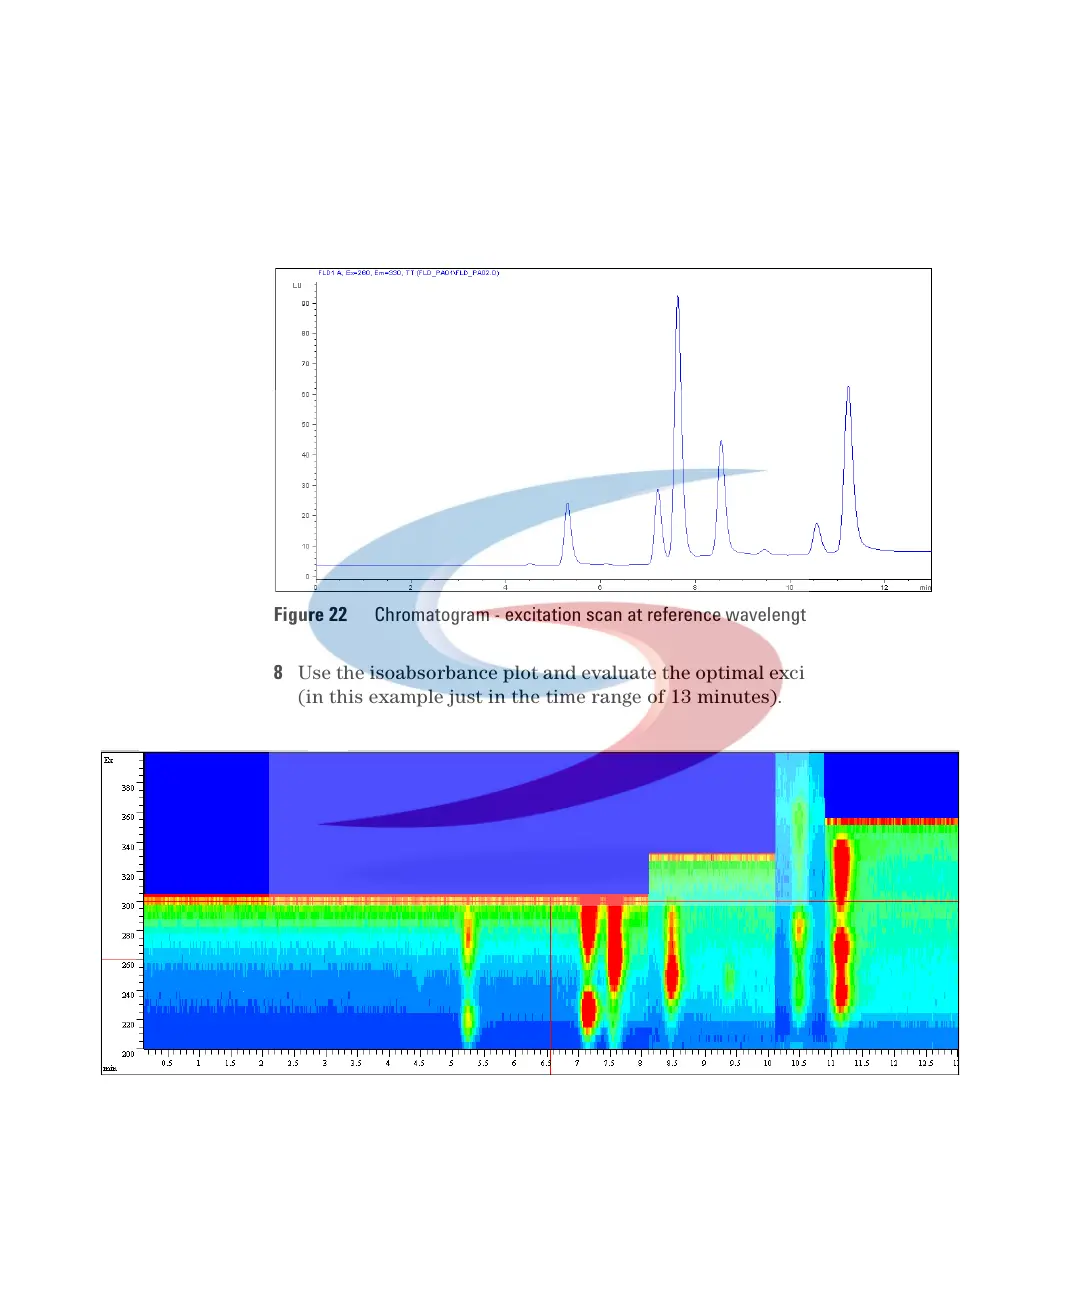
8 Use the isoabsorbance plot and evaluate the optimal excitation wavelengths
(in this example just in the time range of 13 minutes).
Figure 22 Chromatogram - excitation scan at reference wavelength 260/330 nm
Figure 23 Isoabsorbance Plot - Excitation
 Loading...