58 of 220 Anatel A643a Setup - Anatel A643a
RPS - June 2007 - Edition 12
Operator Manual Anatel
The compared values are recorded at the beginning of the analysis and when the data are
reported.
In addition to reporting the uncompensated values, they are monitored for limit excursions.
The Anatel A643a Analyzer compares the uncompensated conductivity value to a set of USP
(United States Pharmacopeia) limits and issues an alarm if the corresponding limit is exceeded
(see “Uncompensated Conductivity Alarms” on page 106).
The Uncompensated Mode is enabled or disabled independent of the individual instrument’s
conductivity (or resistivity) display units. Modifying an Anatel A643a to report temperature-
uncompensated conductivity or resistivity values requires altering its Display Units Screen
to reflect this new output. If an external DAC module is being used, its range may have to be
adjusted to account for the new output (see “Conductivity/ Resistivity Output” on page 134).
Uncompensated Resistivity may be chosen, but this selection is for display only and does not
generate an alarm as the USP limits are not checked in this case.
7) Use the Down Key to scroll to Uncompensated and press Enter to toggle the
checkmark “on” and select the Uncompensated Mode. Choose Conductv µS/cm in
order to report uncompensated conductivity alarms (see “TOC Validation” on page 87).
8) Press Esc repeatedly to exit this function and return to the normal display.
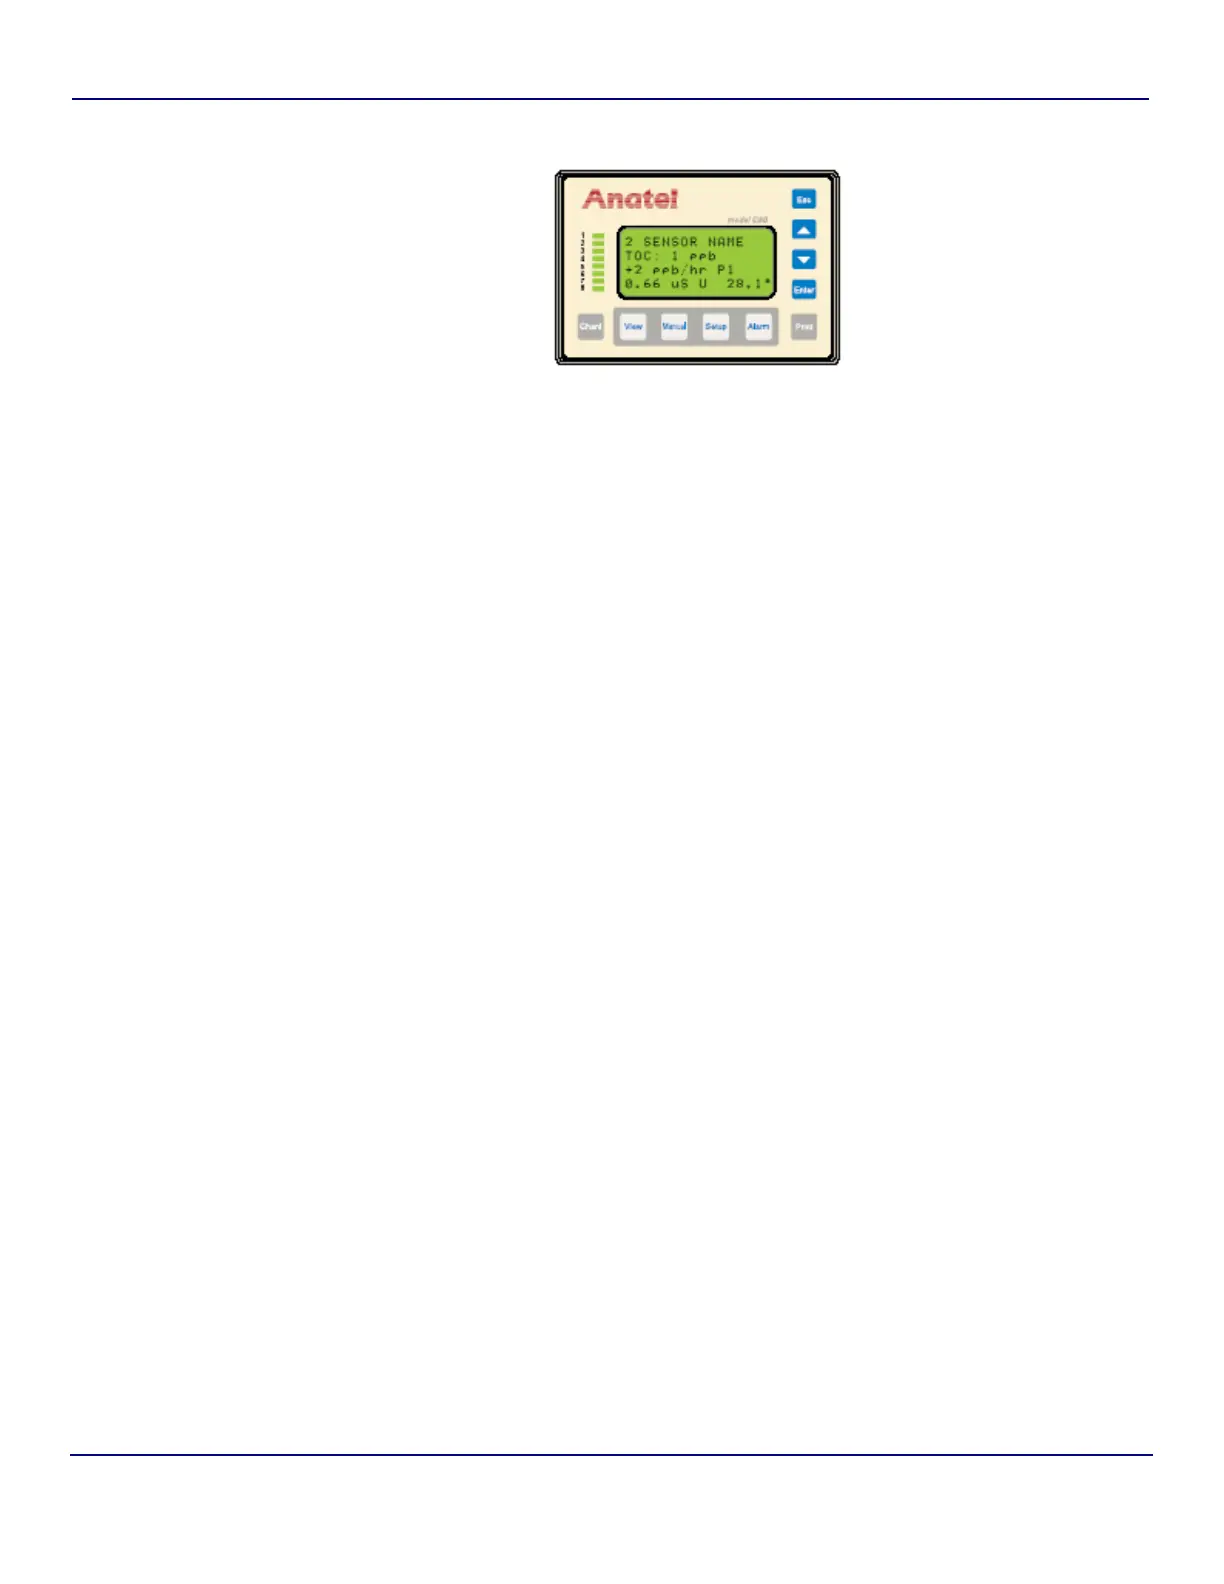
A “C” designates a compensated and a “U” designates an uncompensated value in the
Controller display. Thus, uncompensated conductivity is reported as “µS U” and “M. U” is
displayed for an Analyzer reporting uncompensated resistivity.
The column headers on printed outputs similarly report “COND UNCMP” and “RESIS
UNCMP,” respectively. This also applies to the Gateway and the TOC View program where the
appropriate headers are modified in the report and display columns. In instances where the
data for multiple instruments are combined into a single report or view, a separate unit is given
for each line of data.
Fig 5-12 : Uncompensated Conductivity Display