©2025 Copeland LP.
026-1803 R13 Supervisor I&O User Guide 4 - 9
The five categories are displayed on each application screen.
Click each icon to view applications that have been set up for
each category. For example, in Figure 4-8, the Refrigeration
icon has been clicked and the applications for that category
are displayed (Standard Circuits and XR75CX). Click the
application to go directly to that screen.
4.9 Application Tabs
4.9.1 Performance Meter
Performance Meter gives the user a quick and simple visual
indication of system performance and early insight that
provides an opportunity to take corrective actions to remedy
conditions that may be reducing energy efficiency, causing
required service or ultimately leading to costly failures.
Performance Meter is a licensed application that looks at the
operational performance in relation to a desired setpoint and
calculates a “Figure of Merit” (FOM), which takes into account
deviations above and below setpoints, but excluding
defrosts. The overall FOM value uses both high-temperature
conditions that result in product degradation as well as low-
temperature conditions, which is an energy penalty and most
often goes undetected. Performance Meter gives the user a
graphical representation of performance data that shows
instances for performance that fall outside of the expected
normal performance band.
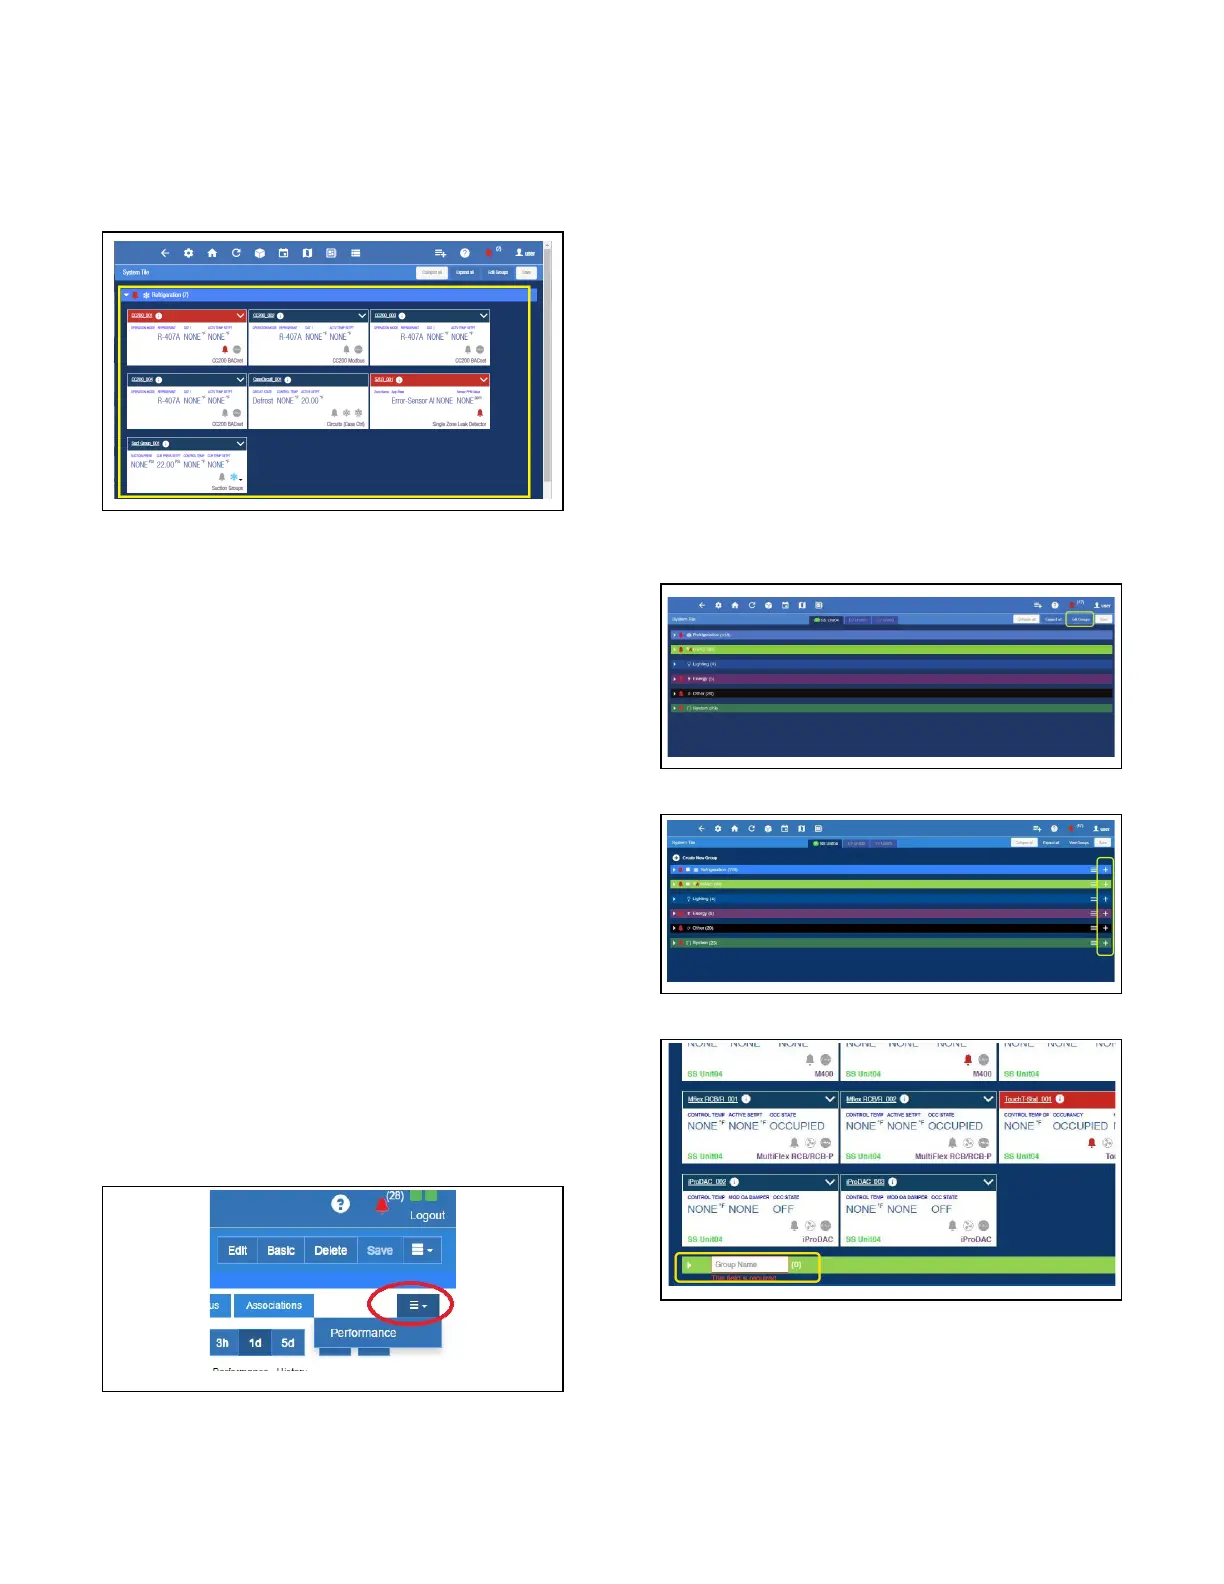
The Performance Meter tab will only be visible if licensed. To
display this tab, the user must click the Advanced button,
then click three-line menu as shown in Figure 4-9, then click
Performance.
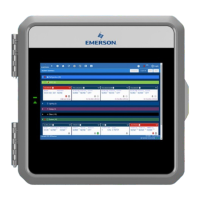
4.9.2 Site Aggregation
Site Aggregation brings together status and data from
multiple controllers into one convenient view. You can drag
and drop the summary information into the order that is most
important to you. This can be your preferred view when you
log in with your user name. You can also create custom
categories, and drag and drop Summary Tiles into categories
and in the order you prefer. Categories appear collapsed by
default on the System Summary screen. (This feature is
supported by all models and not limited to having a Site
Aggregator license.)
To create a new custom category, click Edit Groups on the
upper-right corner of the screen, then click the plus sign that
appears opposite the application name. An open box
(Category Name) will appear. Enter the name of your custom
category and click Save.
The Site Aggregator floor plan now links to E2 peer
application status and overrides. The Site Aggregator can
now be used with an E2 peer network to render E2 status and
overrides on floor plan.
Figure 4-8 - Application Screen Menus
Figure 4-9 - Performance Meter Tab
Figure 4-10 - Click Edit
Figure 4-11 - Click the Plus Sign
Figure 4-12 - Enter Category Name