96
12.2 QC Measure
To run a QC measurement , please ensure that a valid blank measurement has been run and accepted. Associate
the QC measurement to the correct control material lot by select the matching QC name in the selector below
the ‘QC measure’ button on the QC panel. Place the control material sample tube in the sample rotor and click or
tap ‘QC measure’.
The QC measurement results will be added to the QC database and associated with matching QC material lot.
12.3 View QC References
Click or tap the ‘View QC References’ button to see a list of QC lot references stored in the ‘Abacus 5’ analyzer
control database. Target values and ranges can be viewed for any stored QC references.
12.4 View QC Data
Selecting ‘View QC data’ displays QC runs stored in the QC database in a table format that operates the same way
as the ‘Abacus 5’ analyzer database. QC measurement results will have sequential ID numbers. Option buttons
are provided to switch back and forth between viewing QC data and viewing QC diagrams.
12.5 View QC Diagrams
Click or tap ‘View QC diagrams’ to see the QC diagrams for control measurements.
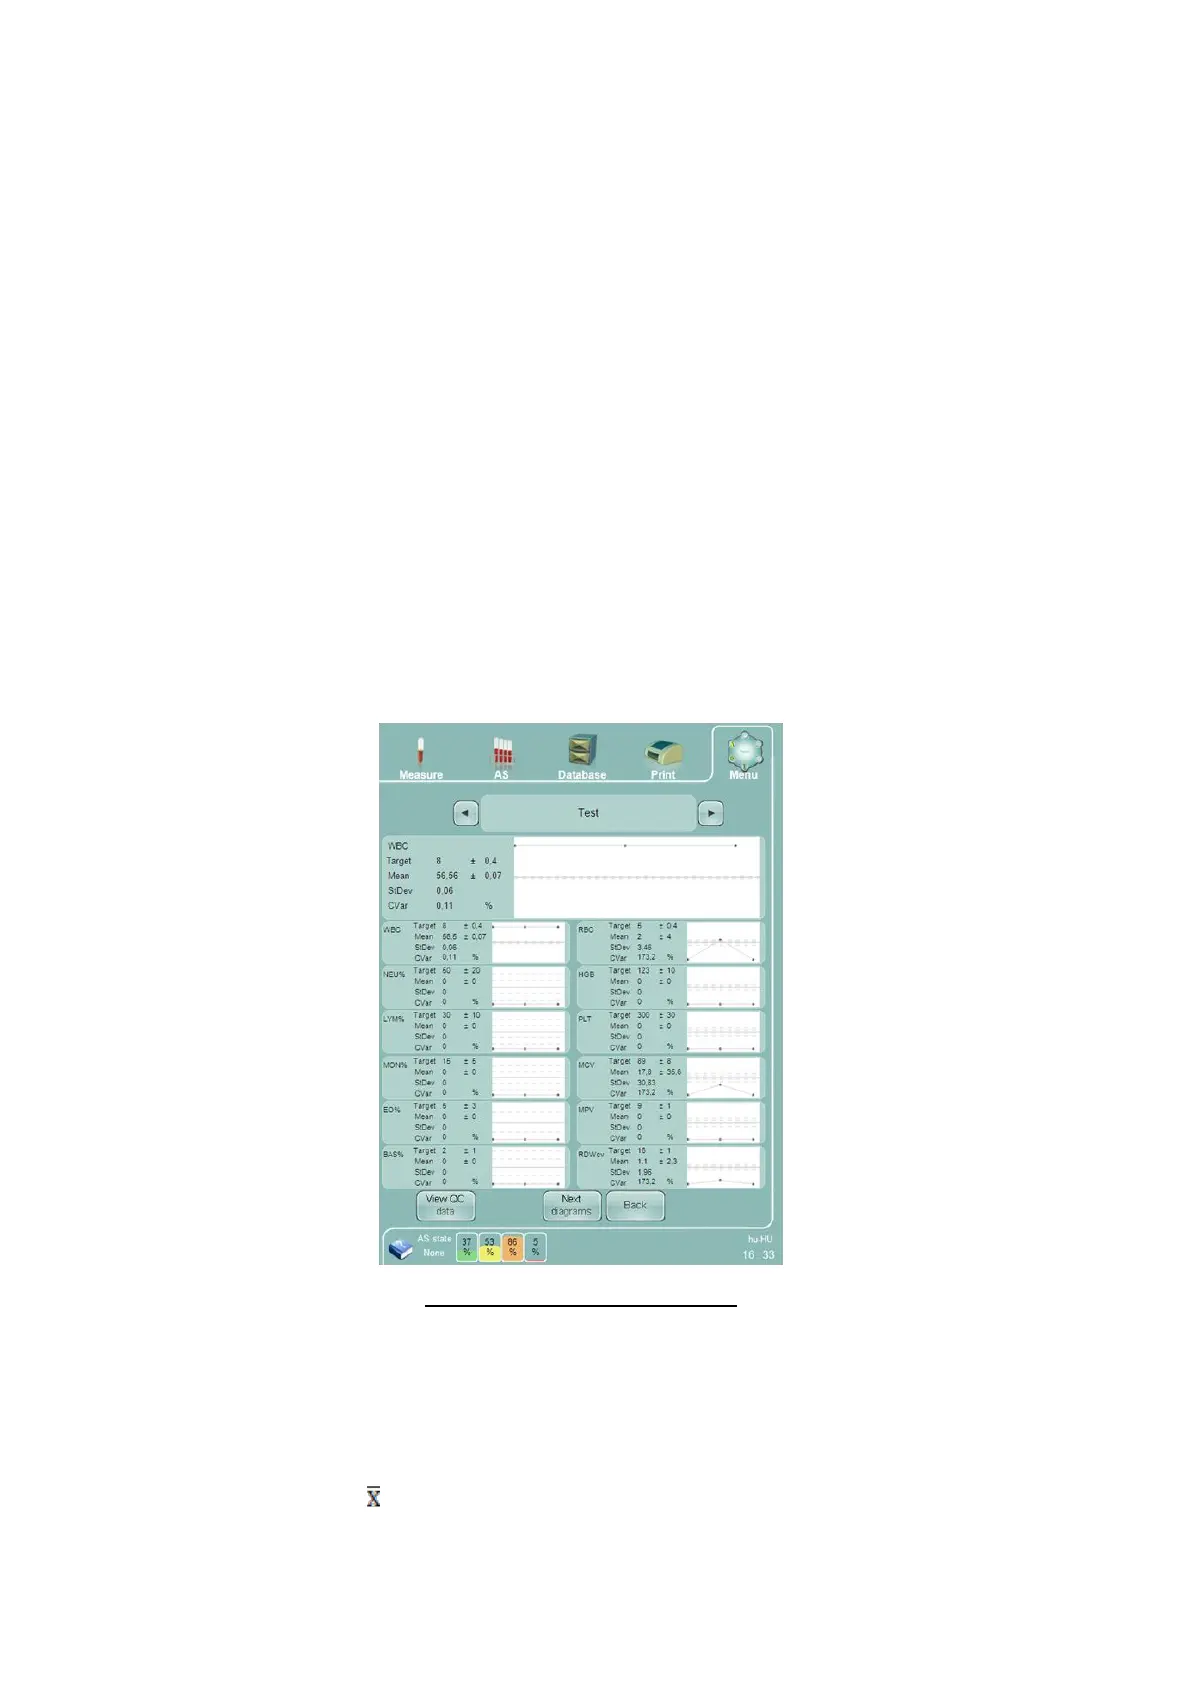
Figure 66. View QC Diagrams Panel
Means, standard deviations (StDev) and coefficients of variation (CVar) are calculated based on the QC analyses.
The dotted lines delineate acceptable ranges on QC diagrams. Use the selector control at the top of the panel to
view graphical control information for other lots of control materials.
12.6 View X-B Data
Abacus 5 offers X-B (a.k.a: X-bar, ) to facilitate trend analysis of samples run.