70
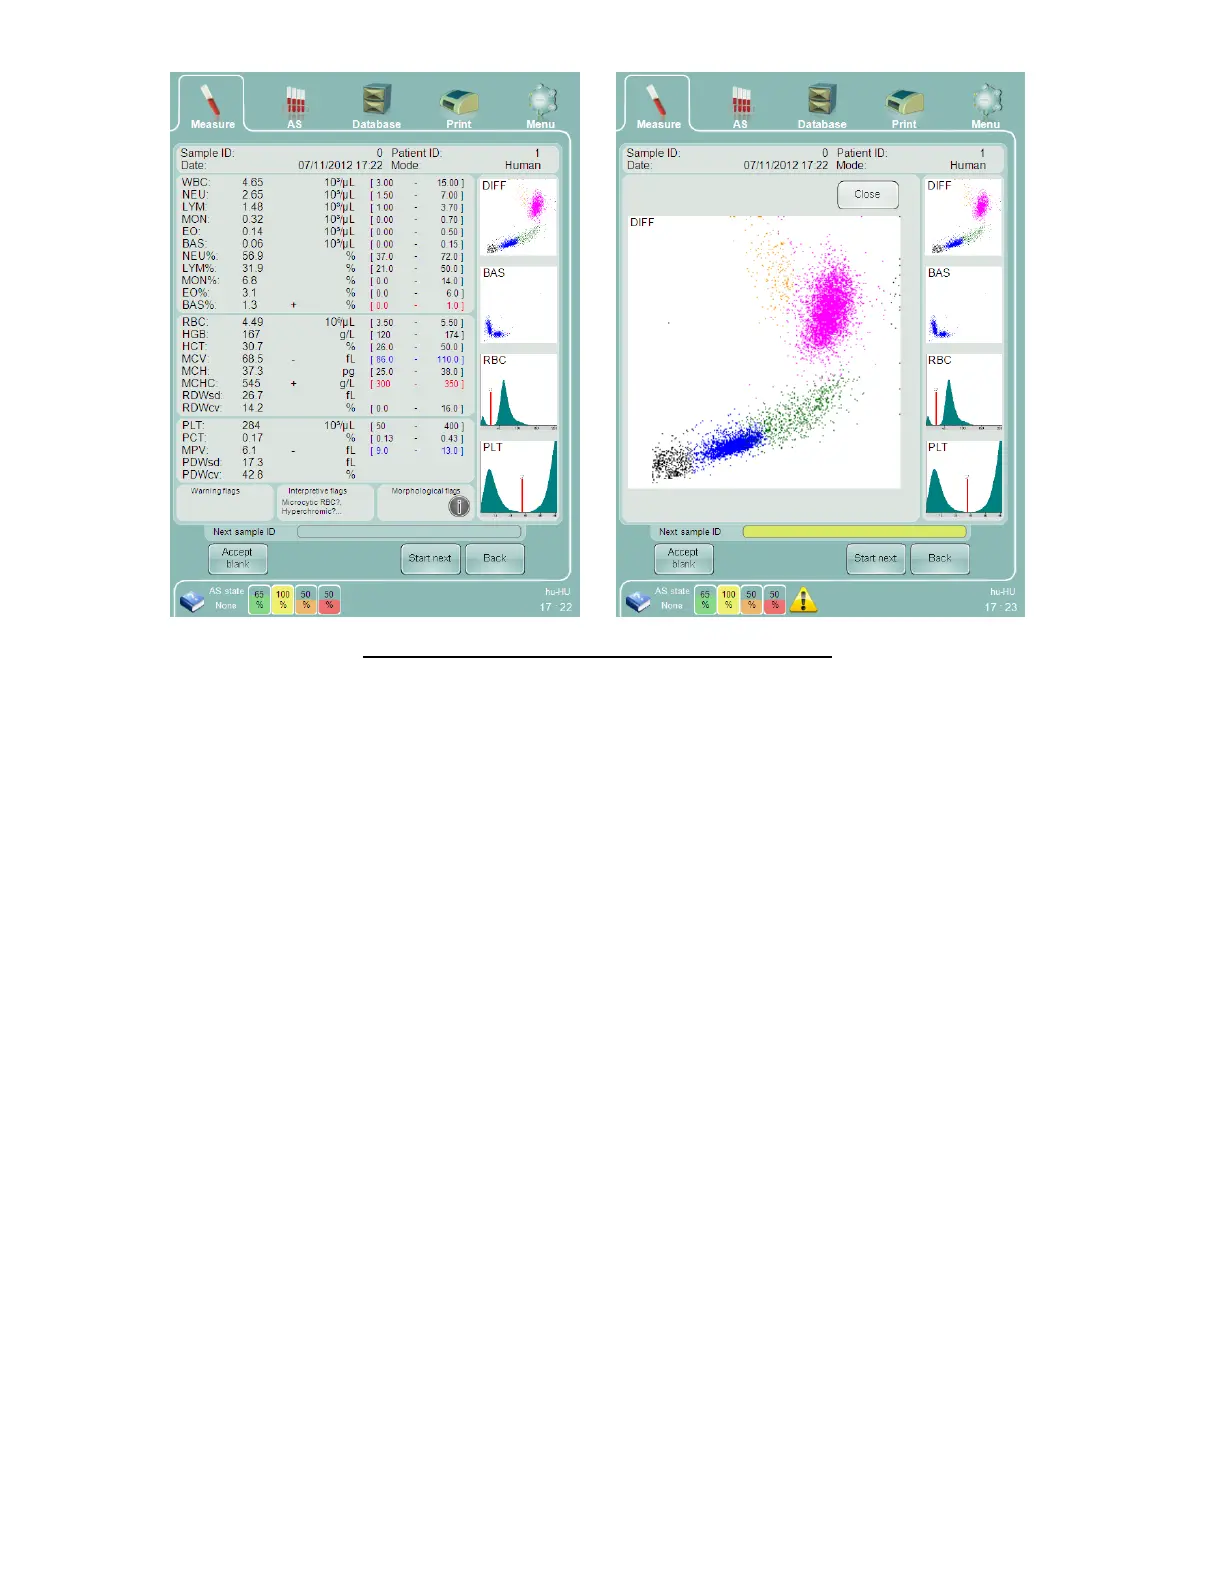
Figure 44. Results Display and Magnified Scatter Plot
Comparison of parameters to the normal range can be displayed numerically or graphically. See section 15.1 for
more information on display of normal range status. Other kinds of flags are also displayed in the result screen.
See section 1 for detailed information about the ‘Abacus 5’ result screen.
8.6 Printing Reports
Click or tap the Print icon at the top of the screen to send a report (or any displayed screen) to the external printer.
8.7 The Measurement Process
The ‘Abacus 5’ analyzer measures 24 parameters of whole human blood samples. Internal dilutions are made to
allow measurement of particles in the sample. Manual or automatic mode samples are processed in the same way.