75
cell. One portion of this scattered light is proportional to size of the cell; the other is proportional to the complexity
of the internal structures in the cell.
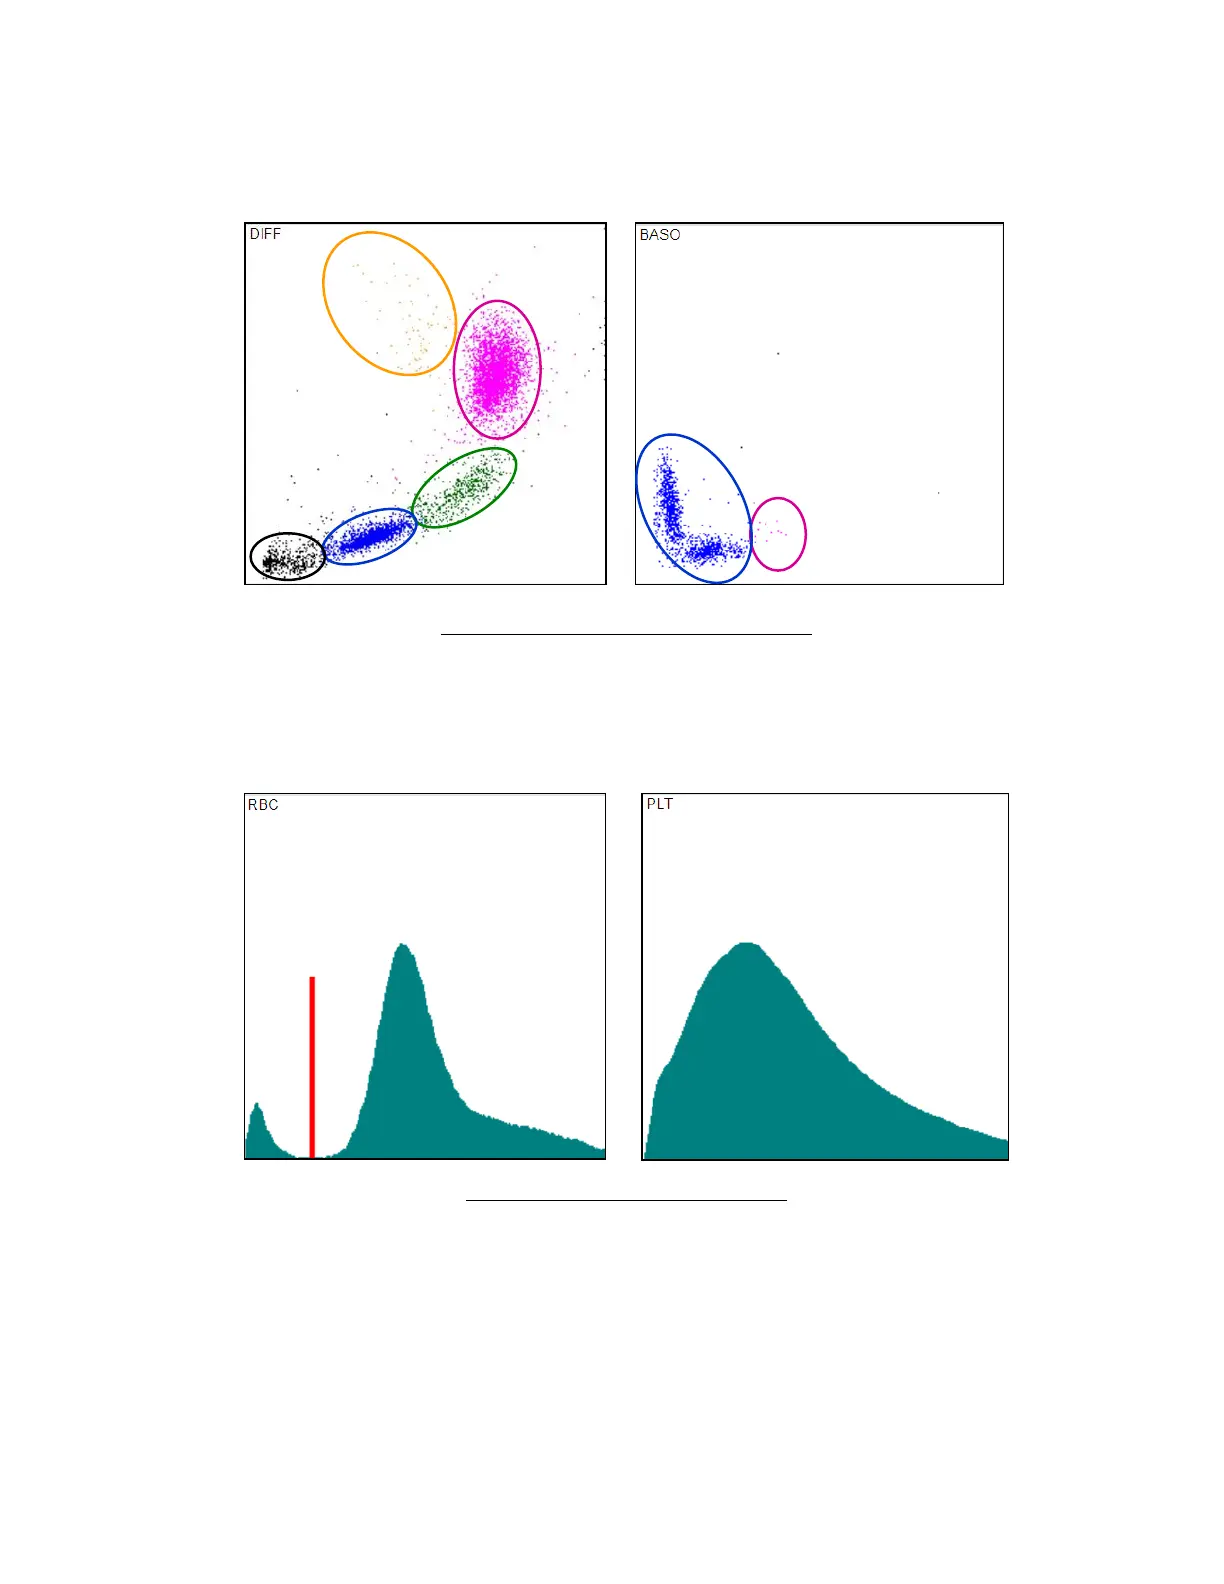
Cells in a leukocyte sub-population have similar light scattering properties, allowing them to be grouped together and
identified separately from other cell types. Different colors are used to identify various populations of blood cells.
Figure 49. Result Screen Scatter Diagrams
RBC and PLT impedance-based measurements are represented by histograms. These diagrams show the number of
cells on the Y axis and the cell size on the X axis. Smaller cells are displayed on the left side of the histogram, and
larger cells are displayed on the right side. The height of the histogram at a given size represents the number of cells
with that size. Greater histogram height indicates more cells.
Figure 50. Result Screen Histograms
Both the RBC and PLT histograms can be zoomed. Discriminators (thresholds) are displayed with red color. Platelets
are located on the leftmost part of the RBC histogram to the left of the red discriminator. The PLT histogram is a
magnified version of this region.