97
The X-B moving average is an algorithm which is capable of tracking changes of the accuracy-alternating of the
measurements. The algorithm observes the alteration of the derived values which are generally stable.
For example the MCV, MCH and MCHC values show the proportion between the blood components. These values
fall within narrow limits in human blood therefore these values are able to show the drifting of the device.
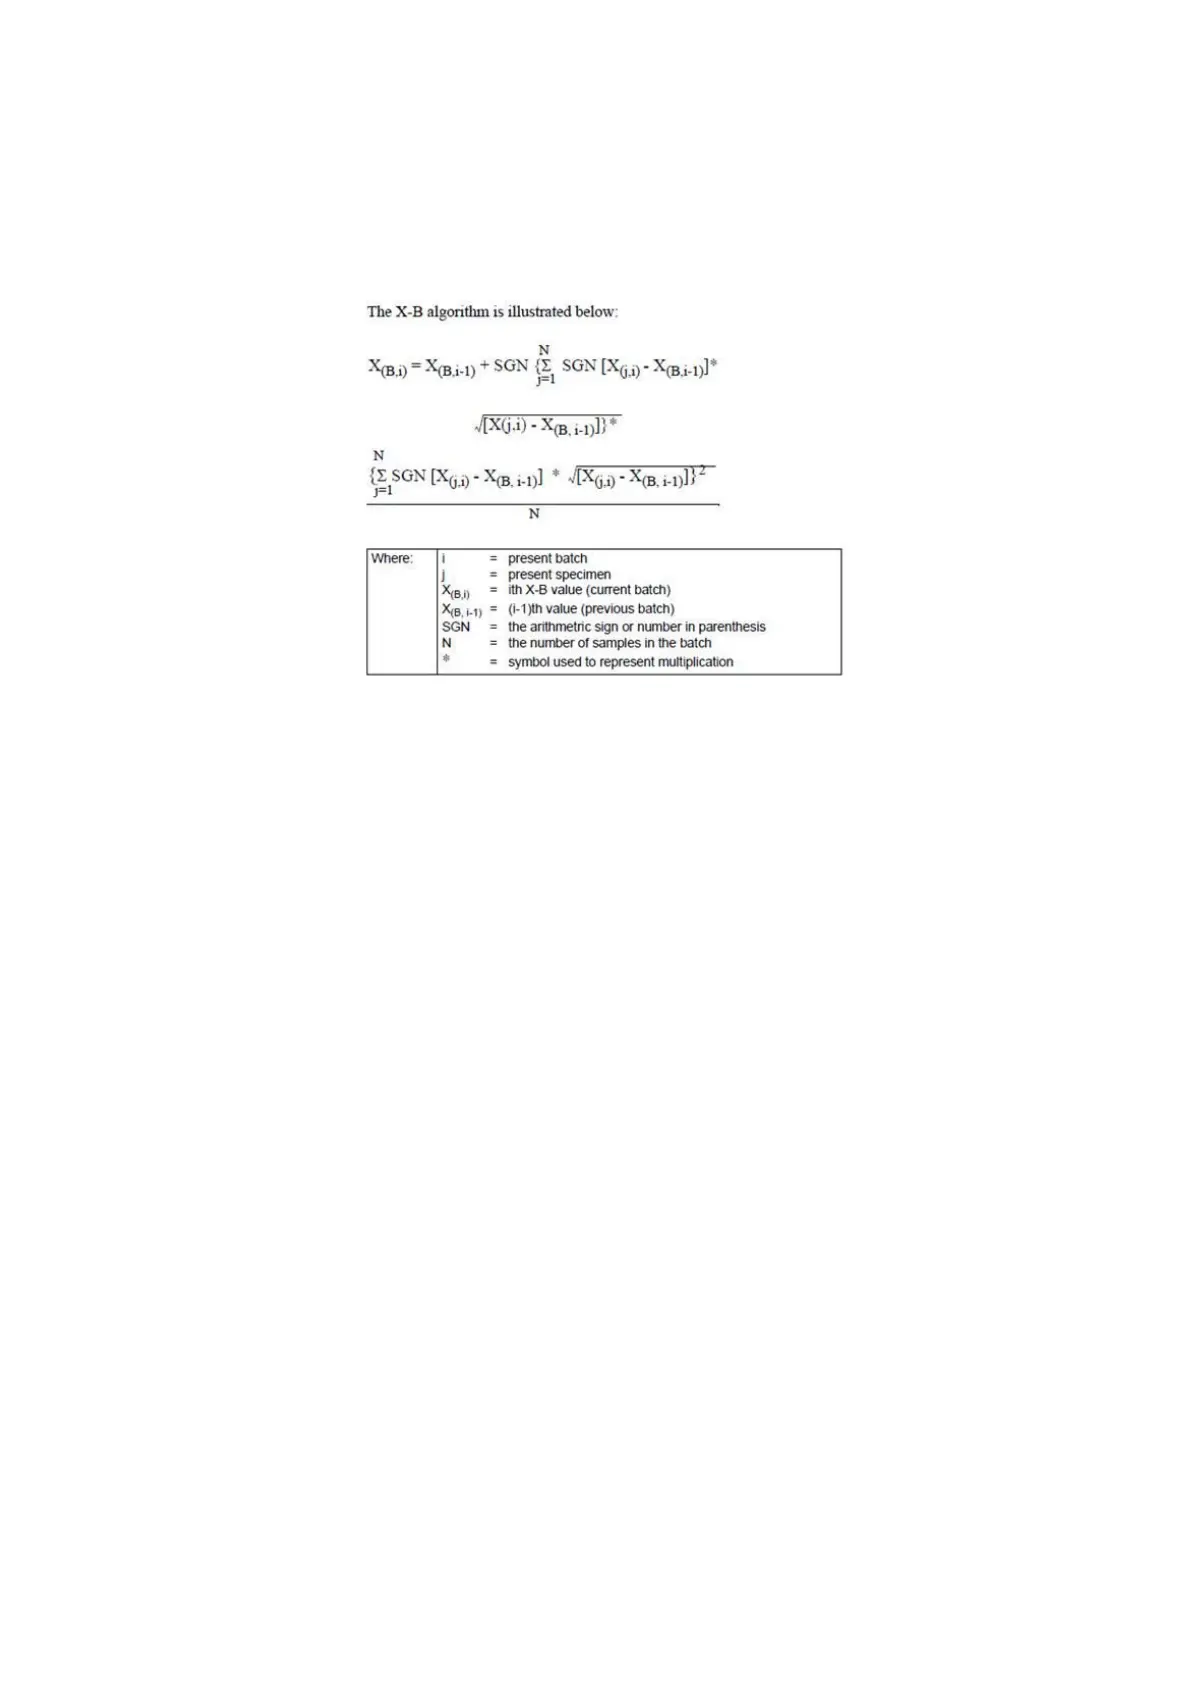
The X-B algorithm works with batches. There are 20 samples in the batches. The average deviation of the
corresponding batch is calculated as follows:
Divide the average deviation of the corresponding batch by the number of the items in the batch (N = 20). Add
the square of the resulting deviation to the mean. Then the result represents a point on the diagram. The value of
the mean will be changed with all counted average deviation from the corresponding batch.
The average of the first batch (X) equals the target value. All the average deviations belonging to the
corresponding batch are added to the mean with correct signs.
The samples are used in calculation chronologically therefore the copulated deviation points show the deviation
from the mean line.
12.7 View X-B Diagrams
View X-B diagrams displays X-B charts for MCV, MCH, and MCHC.
View X-B data function displays X-B information in a table format similar to view QC data.