74
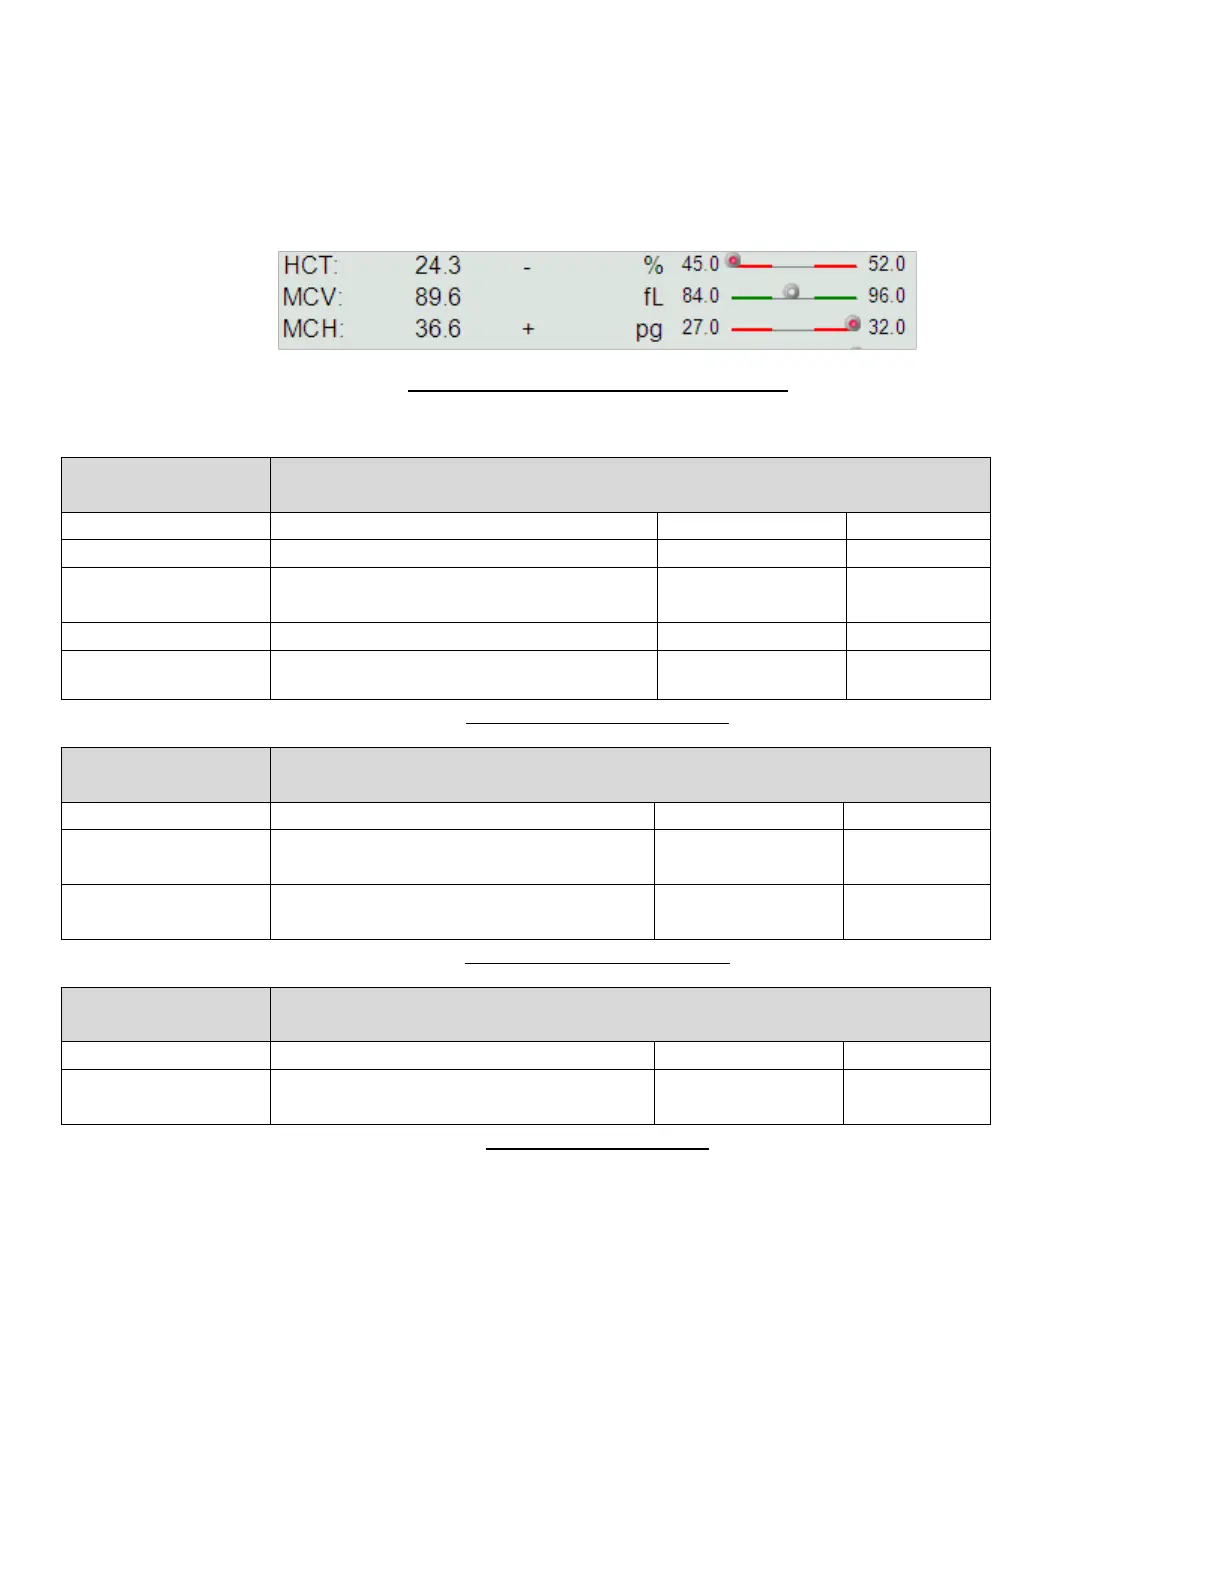
problems. Parameter values falling within the normal range are un-flagged and displayed with black text. Parameter
values falling above the normal range are marked with a ‘+’ and displayed with red text, and values falling below the
normal range are marked with a ‘-‘, and displayed in blue text.
Normal range information can also be conveyed graphically as well as numerically. This setting can be changed in the
Main menu/Settings/Customize panel.
Figure 48. Graphical Normal Range Display
The flags displayed in the parameter information area are as follows:
Normal range flags are raised when a particular parameter is above or below
the normal range, which is defined for the patient profile currently in effect.
Parameter is under normal range
Parameter is under the half of the low
limit of normal range
Parameter is over the normal range
Parameter is over twice the high limit of
normal range
Table 10. Normal Range Flags
Linearity range flags are raised when a particular parameter is above or below
the linearity range of the device.
The related parameter is out of the
linearity range
The related parameter is out of the
display range
Table 11. Linearity Range Flag
A high blank flag is raised when the blank measurement result of the
particular parameter was higher than the blank limit.
The blank value of the related primary
parameter is high
Table 12. High Blank Flag
9.3.1 Scatter Diagrams and Histograms
The ‘Abacus 5’ analyzer displays the results of the optical measurements in scatter diagram representation. Scatter
diagrams represent two-dimensional data. There are two scatter diagrams in the patient report: the 4-DIFF and BASO
scatter diagrams.
The 4-DIFF scatter diagram displays cells identified after the first lysing and optical measurement process. Due to the
measurement technology, cells are classified based on their optically detected properties: low and high angle
scattered light intensity. The optical detector can measure the intensity of the light scattered or diffracted by each