EasyManua.ls Logo

Diatron Abacus 5 - Carryover; Sample Stability; Mode to Mode; Reference Ranges

Diatron Abacus 5
165 pages
Print Icon
To Next Page IconTo Next Page
To Previous Page IconTo Previous Page
Loading...
152
22.7.4 Carryover
Parameter
Allowable Carryover
Units
WBC
< 1.00%
10
3
/µl
RBC
< 0.50%
10
6
/µl
HGB
< 0.80%
g/dl
PLT
< 1.00%
10
3
/µl
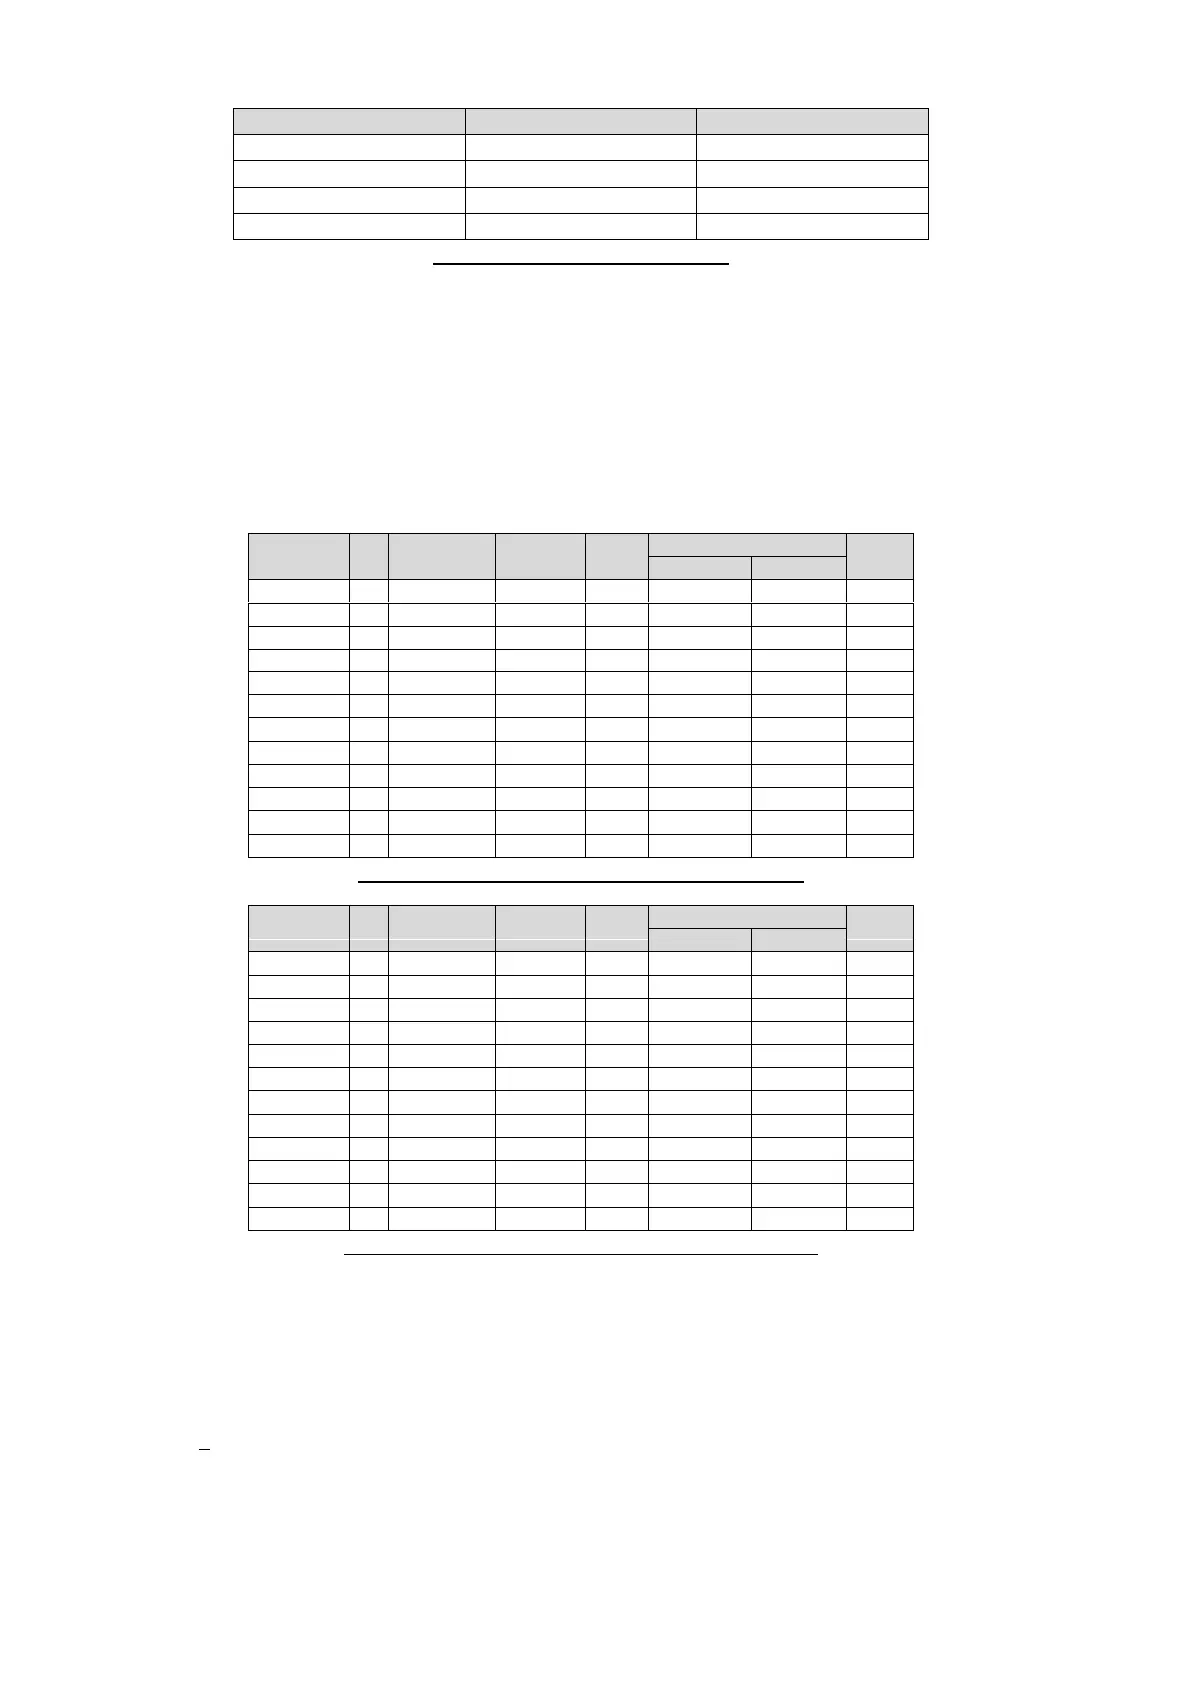
Table 29. Carryover Performance
22.7.5 Sample Stability
Sample stability is characterized by the absolute and percent difference from the baseline values measured after
30 minutes of venipuncture for the parameters WBC, LYM%, MID%, GRA%, RBC, HGB, HCT, MCV, RDW and PLT.
For MPV, the baseline shall be 2 hours after venipuncture. Either the absolute or percent difference must be
under either the absolute or the percent difference criteria indicated in the table in section 22.7.2. The minimum
expected stability is 7 hours from venipuncture.
22.7.6 Mode to Mode
Parameter
n
Correlation
Intercept
Slope
Mean
Units
Closed Vial
Open Vial
WBC
40
0.9997
-0.055
1.008
13.152
13.200
10
3
/l
NEU%
40
0.9954
-0.573
1.006
58.025
57.868
%
LYM%
40
0.9963
-0.025
1.004
30.696
30.661
%
MON%
40
0.9750
0.202
0.970
8.780
8.767
%
EOS%
39
0.8953
0.323
0.927
1.356
1.659
%
BAS%
40
0.6944
0.454
0.547
0.959
0.980
%
RBC
40
0.9989
-0.014
1.003
4.274
4.276
10
6
/l
HGB
40
0.9956
-0.105
1.016
12.104
12.191
g/dl
MCV
40
0.9957
-1.675
1.020
86.330
86.404
fl
RDWcv
39
0.9925
-0.212
1.015
16.263
16.327
%
PLT
39
0.9976
4.401
0.997
246.177
249.886
10
3
/l
MPV
40
0.9315
0.290
0.953
7.830
7.763
fl
Table 30. Closed vs. Open Vial Mode Performance
Parameter
n
Correlation
Intercept
Slope
Mean
Units
Closed Vial
Open Vial
WBC
40
0.9998
-0.050
1.015
13.152
13.055
10
3
/l
NEU%
40
0.9967
-0.391
1.006
58.025
57.794
%
LYM%
40
0.9957
0.104
1.013
30.696
30.263
%
MON%
40
0.9654
0.551
0.887
8.780
9.314
%
EOS%
39
0.9224
0.219
0.917
1.356
1.541
%
BAS%
40
0.7494
0.400
0.587
0.959
0.986
%
RBC
40
0.9989
-0.056
1.017
4.274
4.259
10
6
/l
HGB
40
0.9985
0.054
1.007
12.104
12.055
g/dl
MCV
40
0.9977
-0.489
1.006
86.330
86.410
fl
RDWcv
39
0.9923
-0.354
1.025
16.263
16.140
%
PLT
39
0.9963
4.795
0.997
246.177
245.949
10
3
/l
MPV
40
0.9236
0.330
0.947
7.830
7.880
fl
Table 31. Closed vs. Autosampler Mode Performance
22.7.7 Reference Ranges
Evaluation of reference ranges for the Abacus 5 hematology analyzer was conducted using a data set of 240
normal human whole blood samples. Of the 240 samples, 120 were from female patients and 120 were from
male patients >22 years of age. Diatron recommends each laboratory establish its own reference ranges.

Table of Contents

Related product manuals