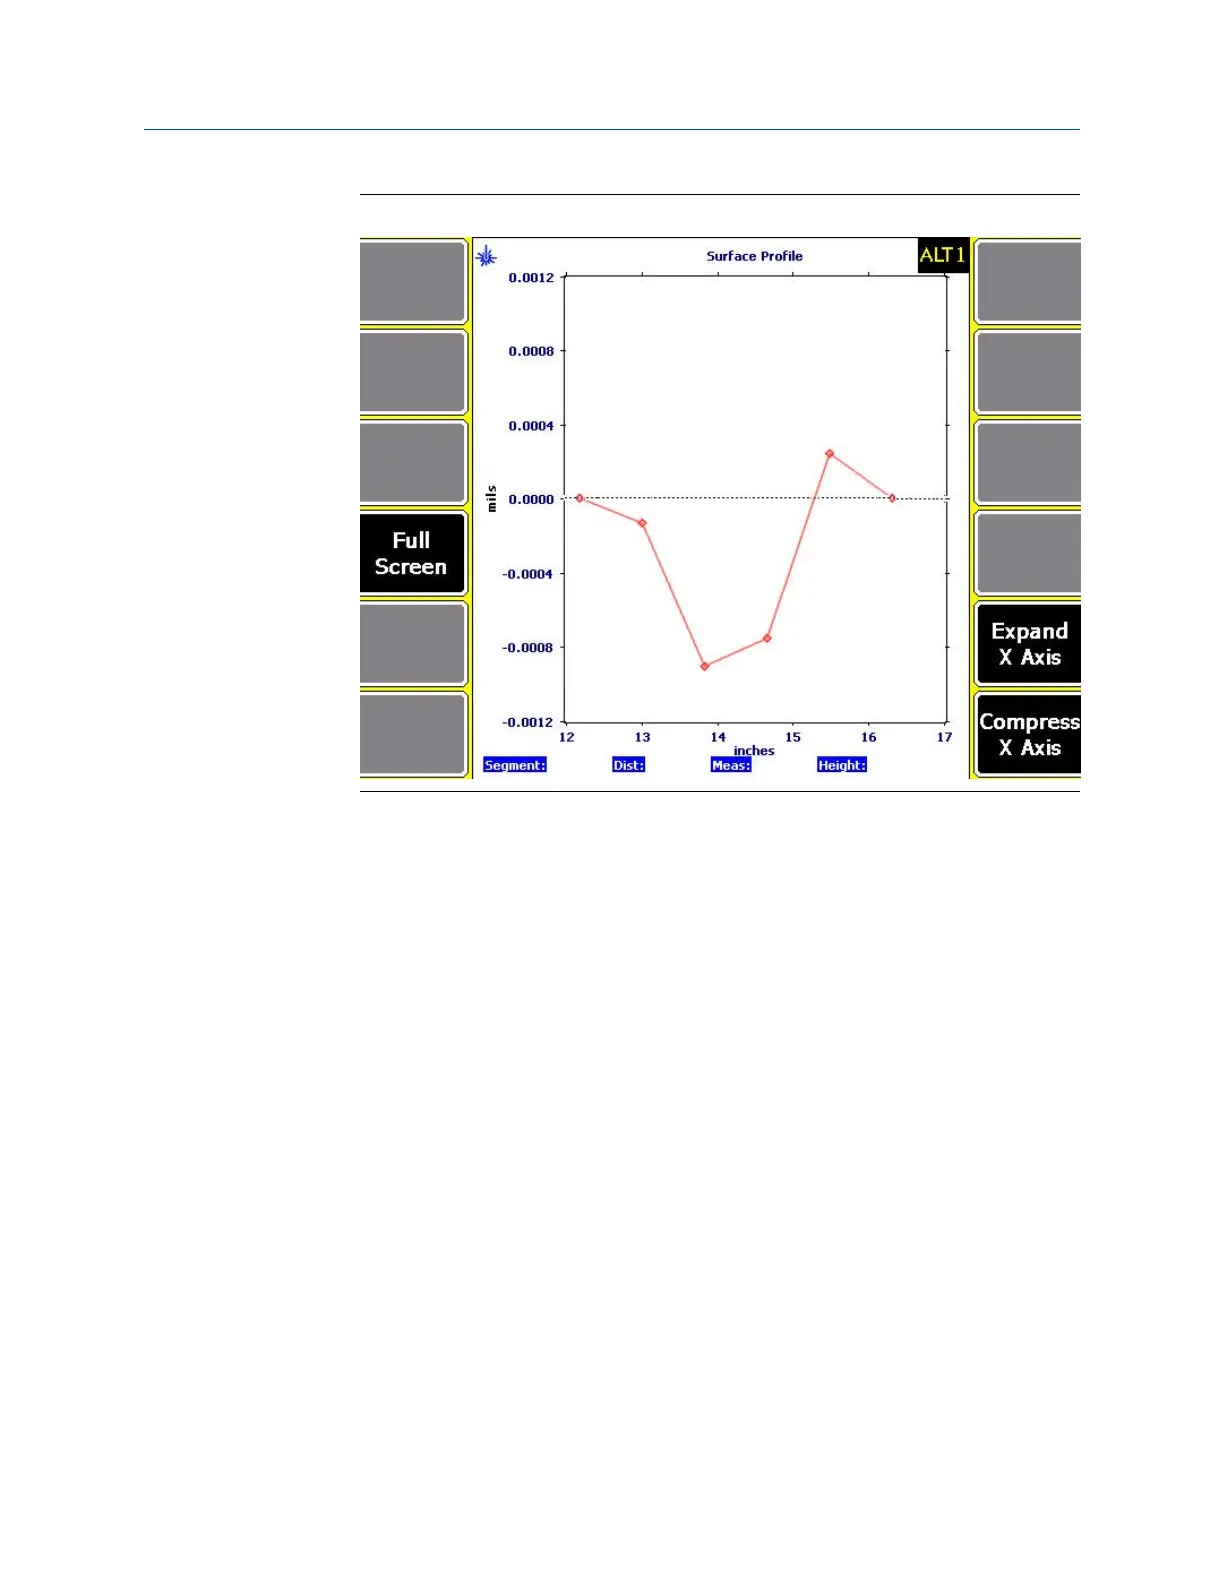
Surface profileFigure 7-45:
2. Review the surface profile plot.
Segment readings are plotted on the graph with lines connecting each reading. A
reference line is displayed horizontally along the origin of the Y axis.
When the analyzer plots the straightness profile, the relationship of the measured
readings to the reference line is plotted instead of the actual measured readings.
The height of the first and last segment are set to zero; they are located on the
reference line. The height for all other segments is their calculated height from the
reference line.
Any segment where readings have not been measured are displayed at the
appropriate segment distance along the X axis. When the cursor is active in one of
these segments, it will be indicated as not being measured. When a cursor is active,
the following values for the selected reading are displayed below the plot:
• Segment—The segment number.
• Dist—The segment distance.
• Meas—The measured reading.
• Height—The height from the reference line.
Optionally, you can do the following:
a.
Press F4 Full Screen to view the surface profile plot in full screen.
b. Press F11 Expand X Axis to expand the X axis by a factor of two.
c. Press F12 Compress X Axis to compress the X axis by a factor of two.
Advanced Laser Alignment
MHM-97432 Rev 7 245