4.3 Set data collection and display parameters
You can set the data collection and display parameters for an activated route. The default
values are appropriate for most data collection, but you can change them at any time. All
routes in your analyzer use these parameters.
4.3.1 Set the plot type for collected route data
The Select Data Display option applies only to collected data on the Route Data Collection
screen and the data plot. It does not affect the plots displaying during data collection.
Procedure
1.
Activate a route.
2. From the Route Data Collection screen, press ALT > F1 User Setup > F2 Select Data
Display.
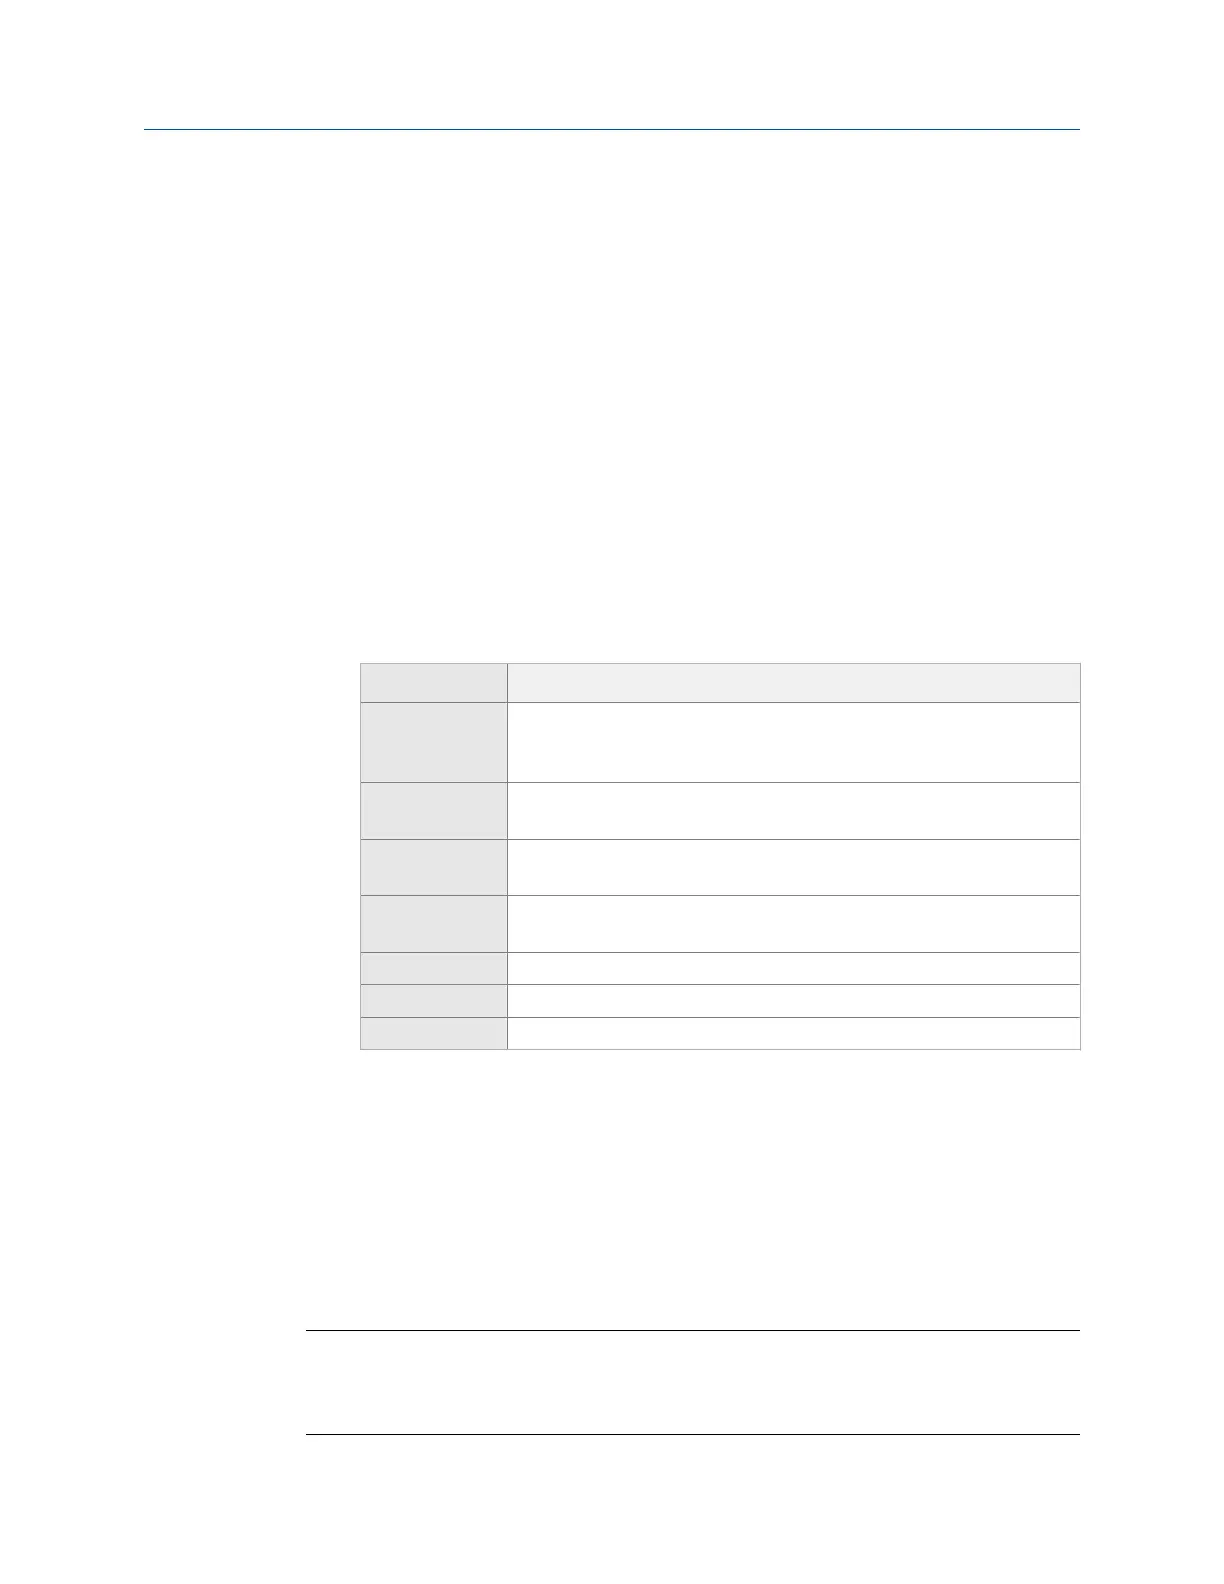
3. Use the up and down arrows to select a plot type.
Option Description
None No plot is displayed on the Route Data Collection screen. This option has
the fastest data acquisition. When you plot the data, a spectrum
displays.
Parameters Display the analysis parameters for the measurement point as text.
When you plot the data, a spectrum displays.
Bar Graph-labeled Display the analysis parameters as a bar graph with labels. When you
plot the data, a spectrum displays.
Bar Graph-no labels Display the data as a bar graph without labels. When you plot the data, a
spectrum displays.
Spectrum Display a spectrum for each point.
Waveform Display a waveform for each point.
Dual Display a waveform and spectra for each point.
4. Press Enter.
4.3.2 Enable or disable Point Advance to automatically move
to the next route measurement point
When you enable Point Advance, the analyzer automatically moves to the next point in the
route after a set amount of time. Set the number of seconds you need to review the point's
data before moving to the next point.
Note
If you grouped points together in your route, the analyzer collects data for those points before
letting Point Advance go to the next point outside the group. For example, if you grouped points 1 and
3, the analyzer collects data for those two points and then Point Advance goes to point 2.
Route
78 MHM-97432 Rev 7