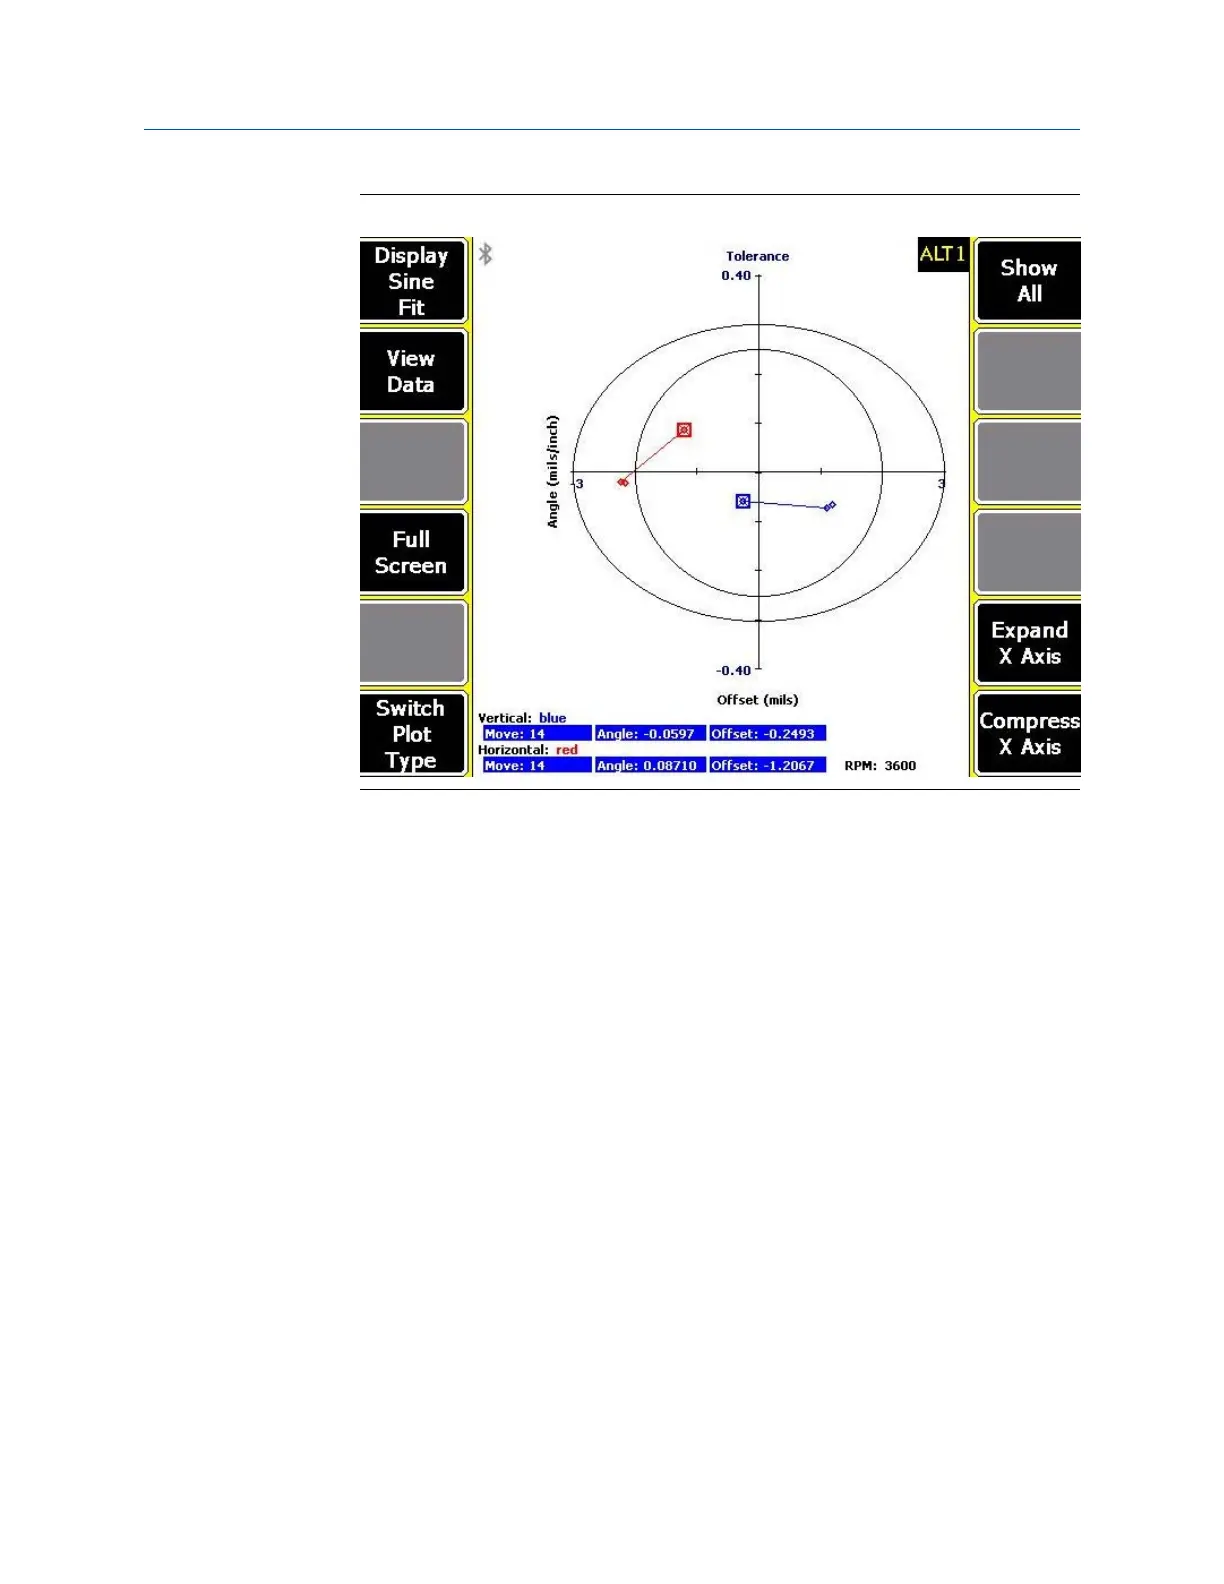
Tolerance plotFigure 7-46:
The tolerance plot displays alignment measurements on an X-Y graph, with line
segments connecting consecutive measurements. For a horizontal alignment job,
the vertical and horizontal alignment results are displayed on the same plot but are
differentiated by the color of the data points.
For horizontal alignment jobs, the tolerance plot displays the offset misalignment
value on the vertical axis and the angular misalignment value on the horizontal axis.
The inner ellipse bounds an area that includes measurements with excellent
alignment tolerance values. The area between the two ellipses includes
measurements with acceptable alignment tolerance values.
If the plot displays multiple measurements, like readings are connected with
straight line segments.
When the cursor is active, the calculated alignment data values for the selected
measurement are displayed at the bottom of the analyzer screen.
Optionally, you can do the following:
a.
Press F1 Display Sine Fit to display the sine fit data plot for the last measurement
data collected. You can manually condition or edit the sine curve data from the
sine fit data plot. See Section 7.8.2 for more information on the sine fit data plot.
This option is available only if the alignment method is Auto Sweep, Manual
Sweep, or Pass Mode.
Advanced Laser Alignment
MHM-97432 Rev 7 247