270
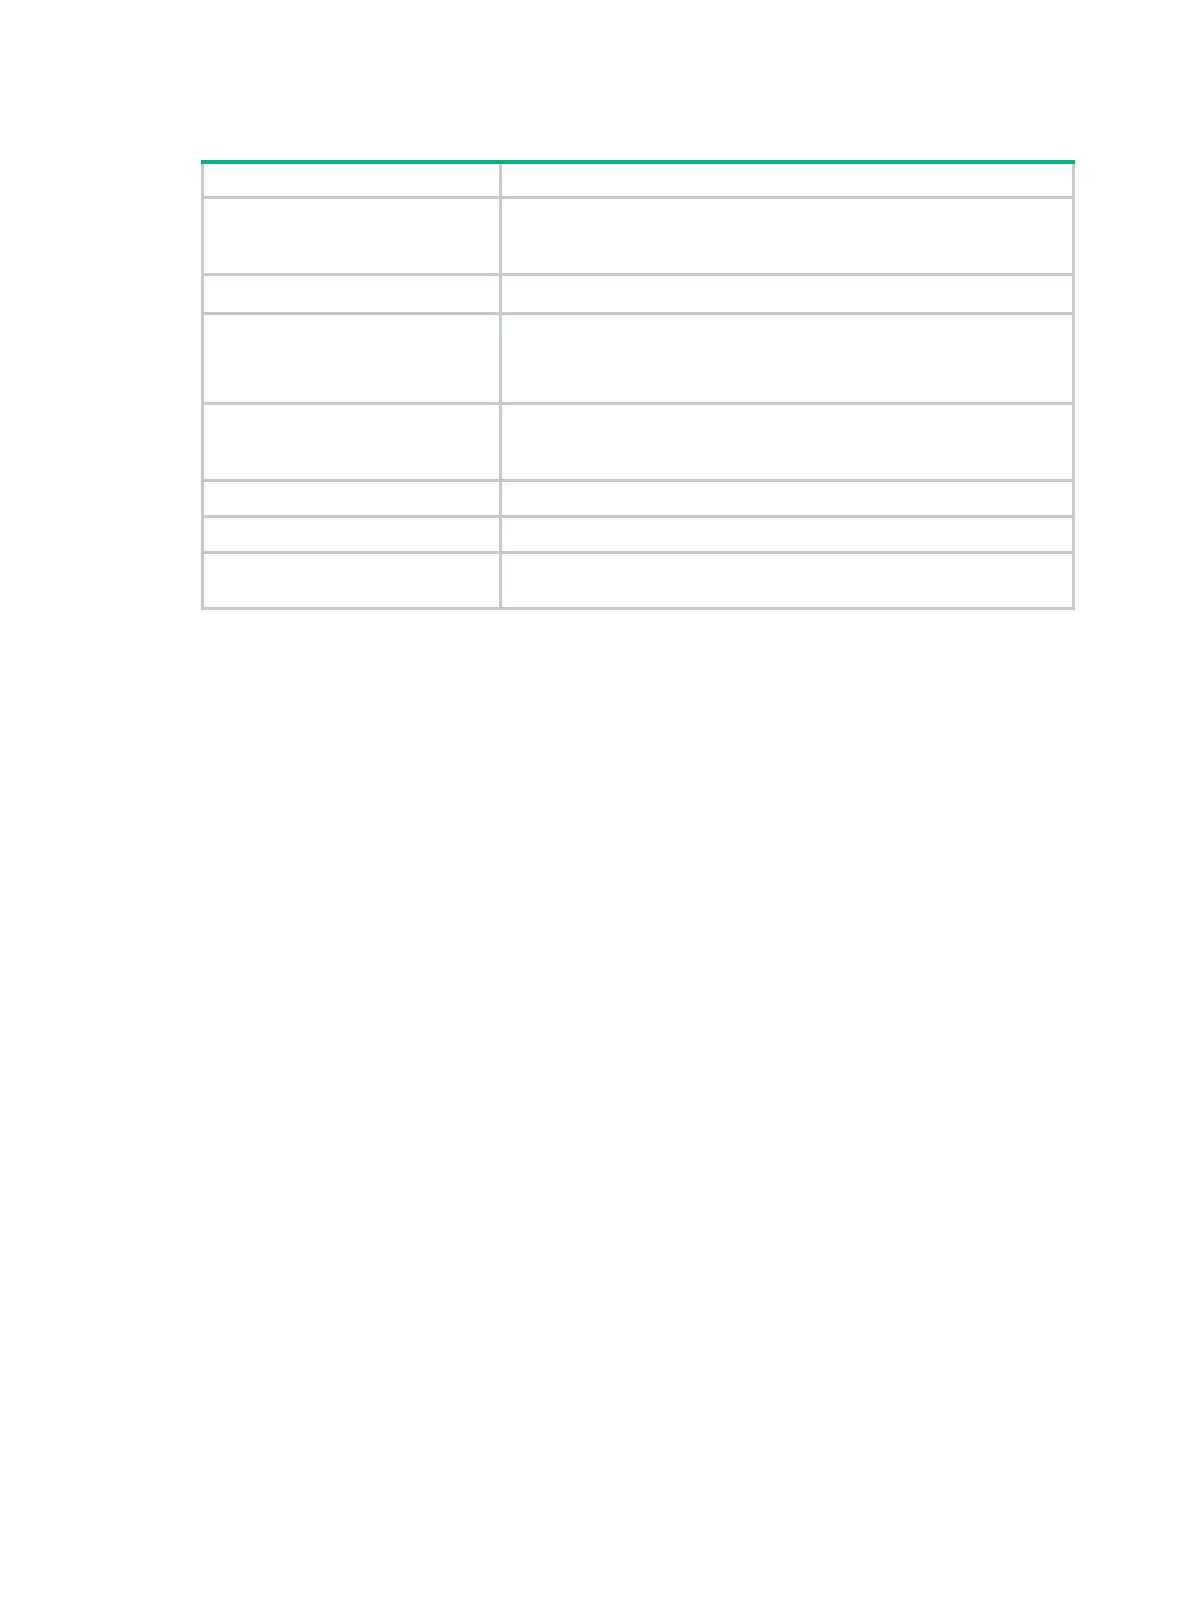
Table 63 Command output
Field Description
Dead loop timer (in seconds): n
Time interval (in seconds) to identify a kernel thread deadloop. A
kernel thread deadloop occurs if a kernel thread runs more than n
seconds.
Dead loop core list CPU cores for which kernel thread deadloop detection is performed.
Dead loop action
Action to be taken in response to a kernel thread deadloop:
• Reboot—Logs the event and reboots the hardware.
• Record-only—Logs the event.
Threads excluded from monitoring
Kernel threads excluded from kernel thread deadloop detection. This
field appears only if the
monitor kernel deadloop exclude-thread
command is configured.
Name Kernel thread name.
TID Kernel thread number.
No thread is excluded from
monitoring
All kernel threads are monitored by kernel thread deadloop detection.
display kernel exception
Use display kernel exception to display kernel thread exception information.
Syntax
display kernel exception show-number [ offset ] [ verbose ] [ slot slot-number [ cpu cpu-number ] ]
Views
Any view
Predefined user roles
network-admin
Parameters
show-number: Specifies the number of kernel exceptions to display, in the range of 1 to 20.
offset: Specifies the offset between the starting exception and the most recent exception, in the
range of 0 to 19. The default value is 0.
verbose: Displays detailed information. If you do not specify this keyword, the command displays
brief information.
slot slot-number: Specifies an IRF member device by its ID. If you do not specify this option, the
command displays kernel thread exception information for the master device.
cpu cpu-number: Specifies a CPU by its number.
Usage guidelines
If an exception occurs to a running kernel thread, the system automatically records the exception
information.
Examples
# Display brief information about the most recent kernel thread exception.
<Sysname> display kernel exception 1
----------------- Exception record 1 -----------------
Description : Oops[#0]
 Loading...