150 User’s Manual INNOMAR Parametric Sub-Bottom Profilers / SESWIN
150 Innomar Technologie GmbH (2023-01)
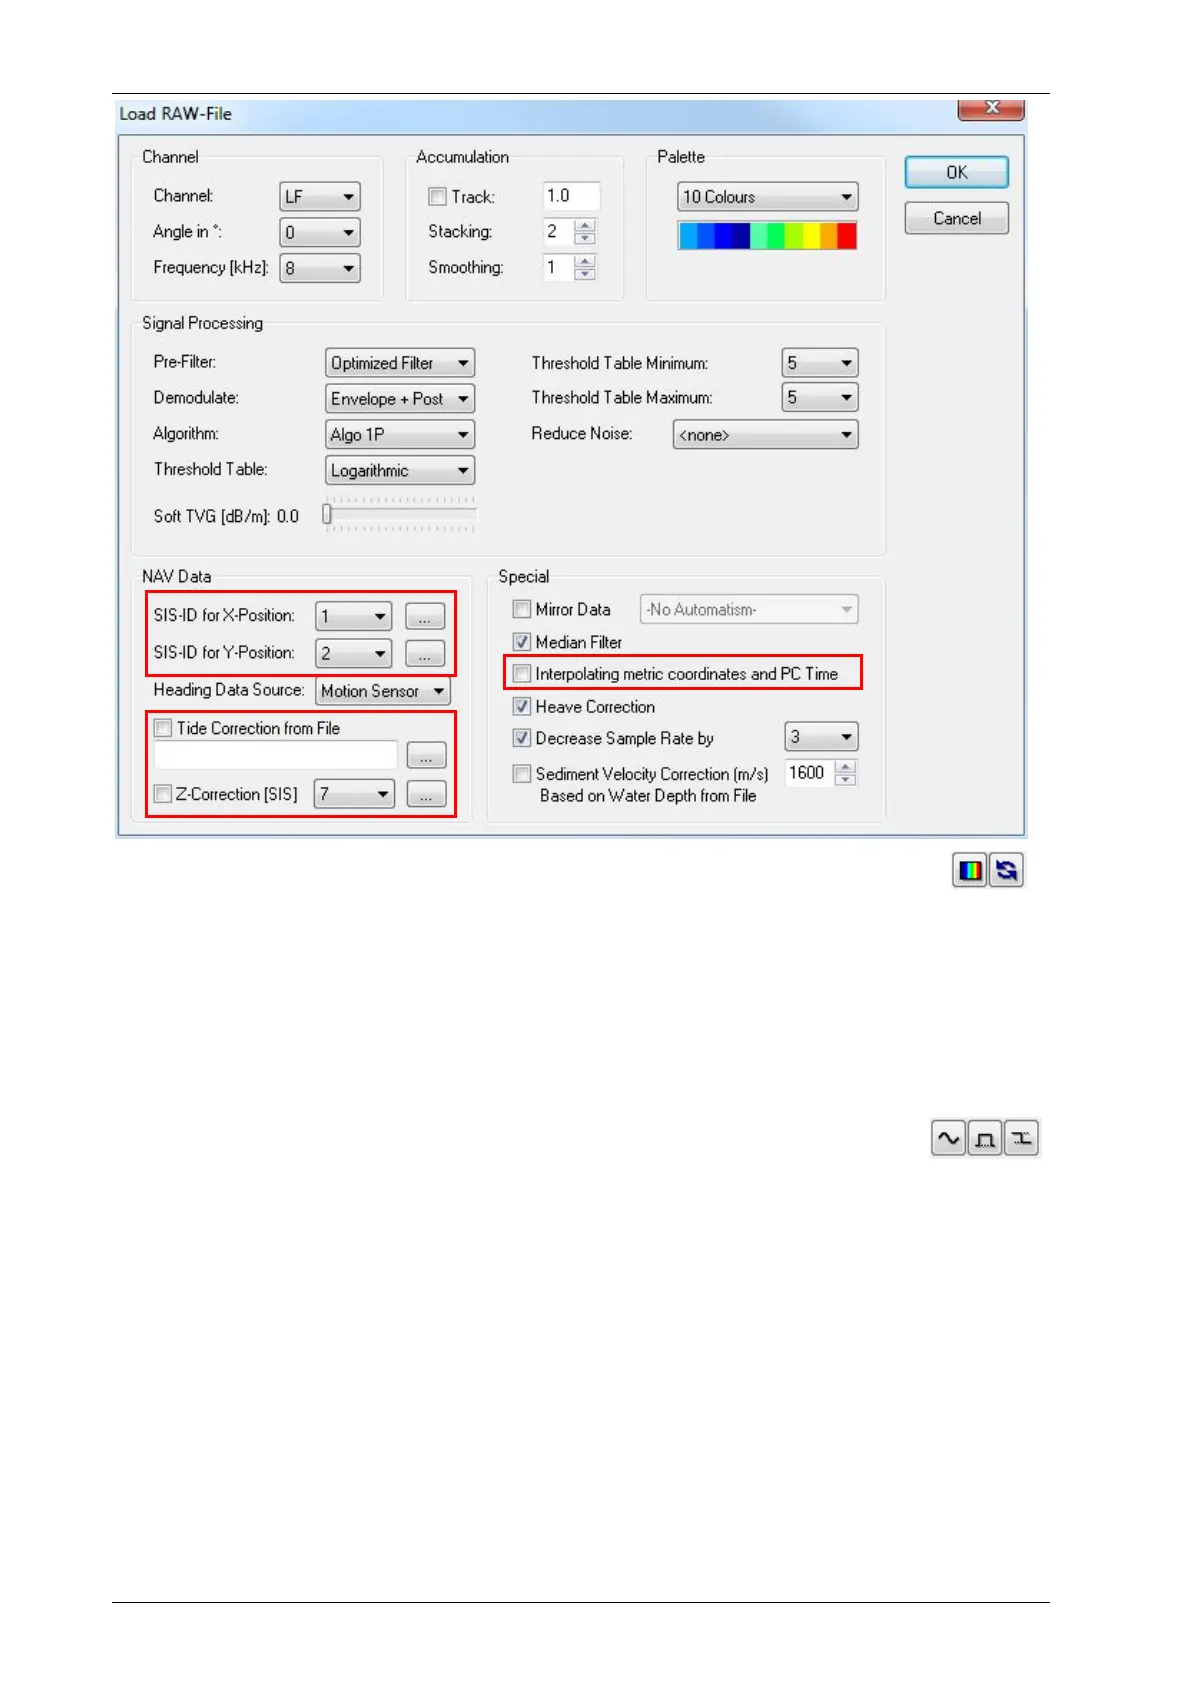
ISE Load RAW File dialogue. Processing settings needs to be verified, most of these can be
changed via the ISE “Signal Processing” and “Colour Palette” dialogues, see buttons on the right.
To get the thickness of a sediment layer or to estimate dredging volumes you need to digitize the
layer boundaries of interest and to export xyz-data of these interfaces.
Let’s start with the water/seabed interface. For this an automatic bottom track can be used. It’s
best to do this on the high-frequency data channel. Therefore, we load both, LF and HF, channels
via the ISE file load dialogue. In the HF echo print we can use the automatic bottom track, see
figure below.
The result of the automatic layer track needs to be verified and cleaned of spikes
or outliers. For this some tools are available from the ISE toolbar:
Sediment layers will be digitized in the low-frequency data. Therefore, copy the HF bottom track
into the LF data window ([Ctrl]+[C] in HF window and [Ctrl]+[V] in LF window). Now the seabed
layer (black line) is in the LF echo print, too.
To digitize sub-seafloor sediment layers ISE provides a semi-automatic capture tool, see figure
below. The user has to define a vertical gate and a certain amplitude level as a sort of threshold
for the layer detection and has to move the cursor over the layer border. The capture tool detects
the layer within the cursor limits on the defined amplitude level. It would be also possible to mark
layer boundaries free-hand using the left mouse button to draw lines.
It is good practise to use different layers and colours for different geological interfaces. Names
and line properties (colour, thickness) can be defined in ISE “Options Environment Data
Windows” dialogue.
The resulting layer data plotted into the LF echo print is shown below.