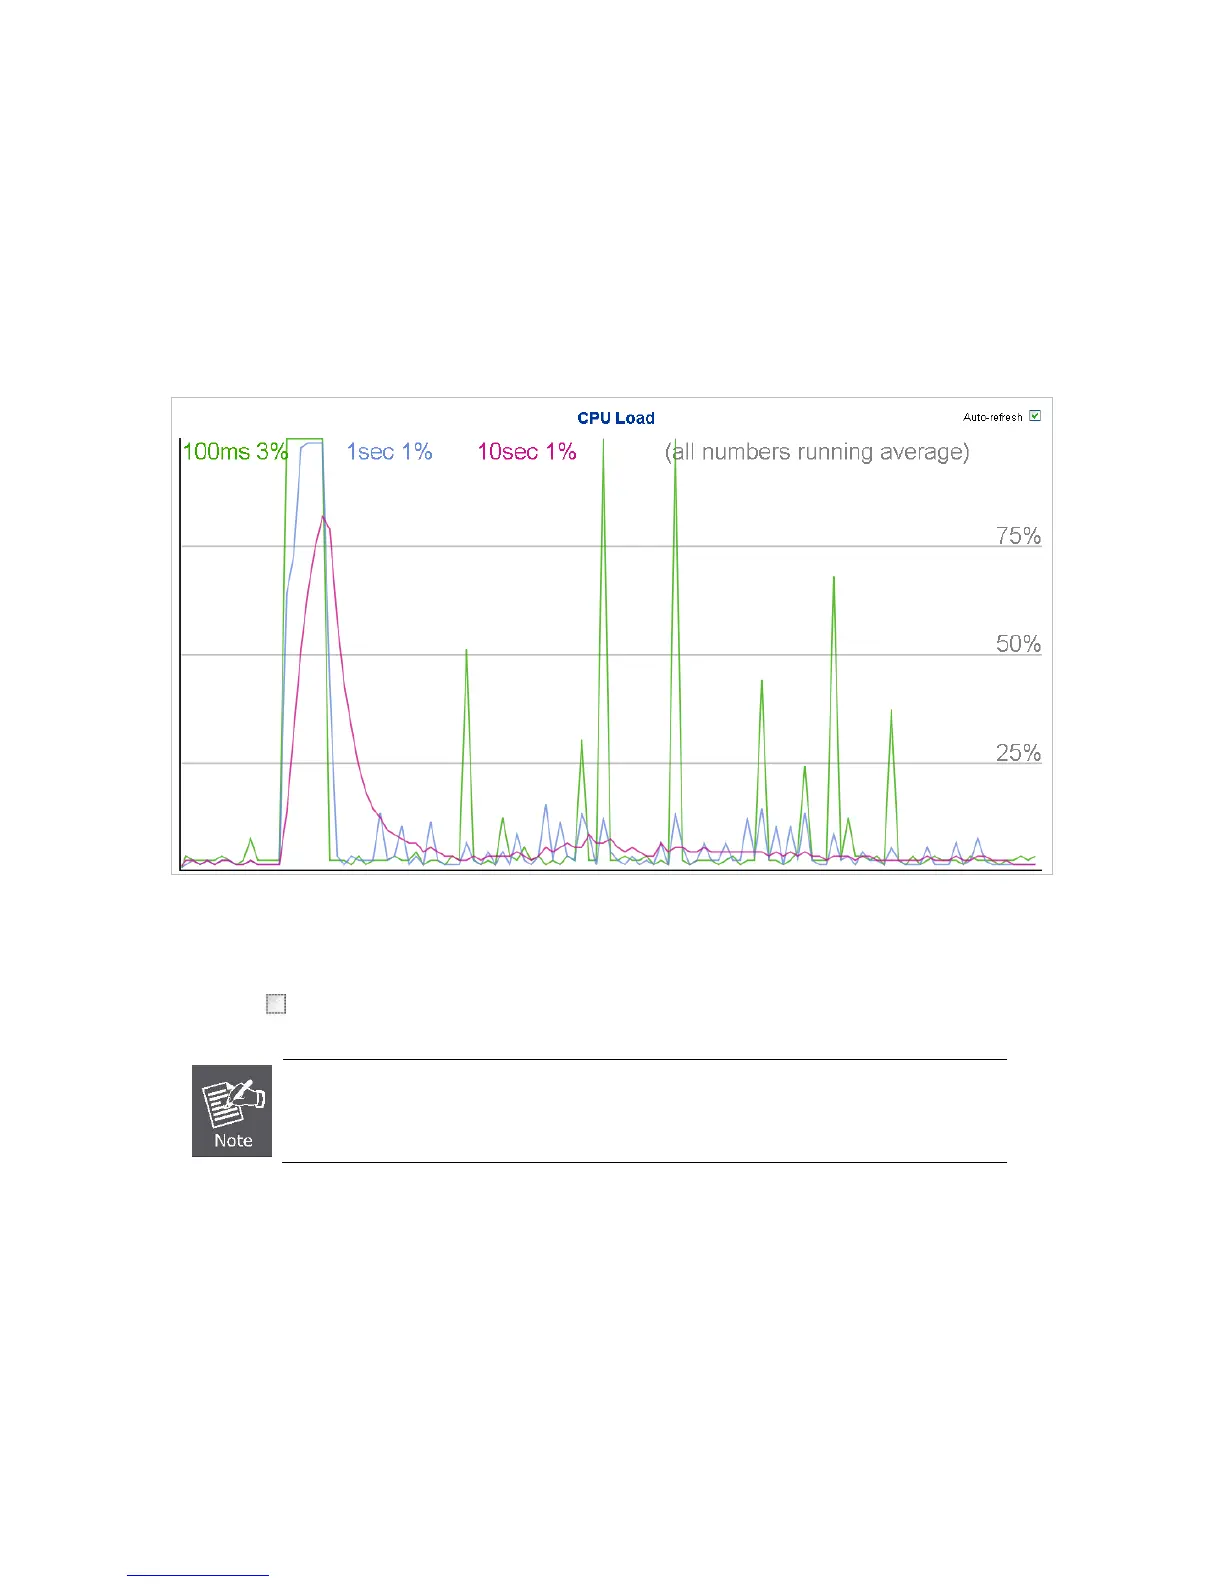
4.2.10 CPU Load
This page displays the CPU load, using a SVG graph.
The load is measured as averaged over the last 100ms, 1sec and 10 seconds intervals. The last 120
samples are graphed, and the last numbers are displayed as text as well.
In order to display the SVG graph, your browser must support the SVG format. Consult the SVG Wiki for
more information on browser support. Specifically, at the time of writing, Microsoft Internet Explorer
will need to have a plugin installed to support SVG. The CPU Load screen in Figure 4-2-13 appears.
Figure 4-2-13: CPU Load page screenshot
Buttons
Auto-refresh : Check this box to enable an automatic refresh of the page at regular intervals.
 Loading...