GAPS - User Guide
6 Visualizing GAPS Data in DELPH RoadMap
6.1 Introduction
DELPH
RoadMap
This section describes the visualization of USBL data in DELPH RoadMap application. For a
complete description of the DELPH RoadMap application and of all its generic functions,
please refer to the specific DELPH RoadMap User Guide.
Visualization
DELPH RoadMap is designed to visualize in three dimensions all kinds of geographical data.
You can visualize in DELPH RoadMap the USBL geographic positions in real-time as well as
in off-line mode. DELPH RoadMap displays the USBL data with the navigation of the ship as
well as any background images and coastlines.
Visualization
modes
These are the ways to visualize USBL data in DELPH RoadMap:
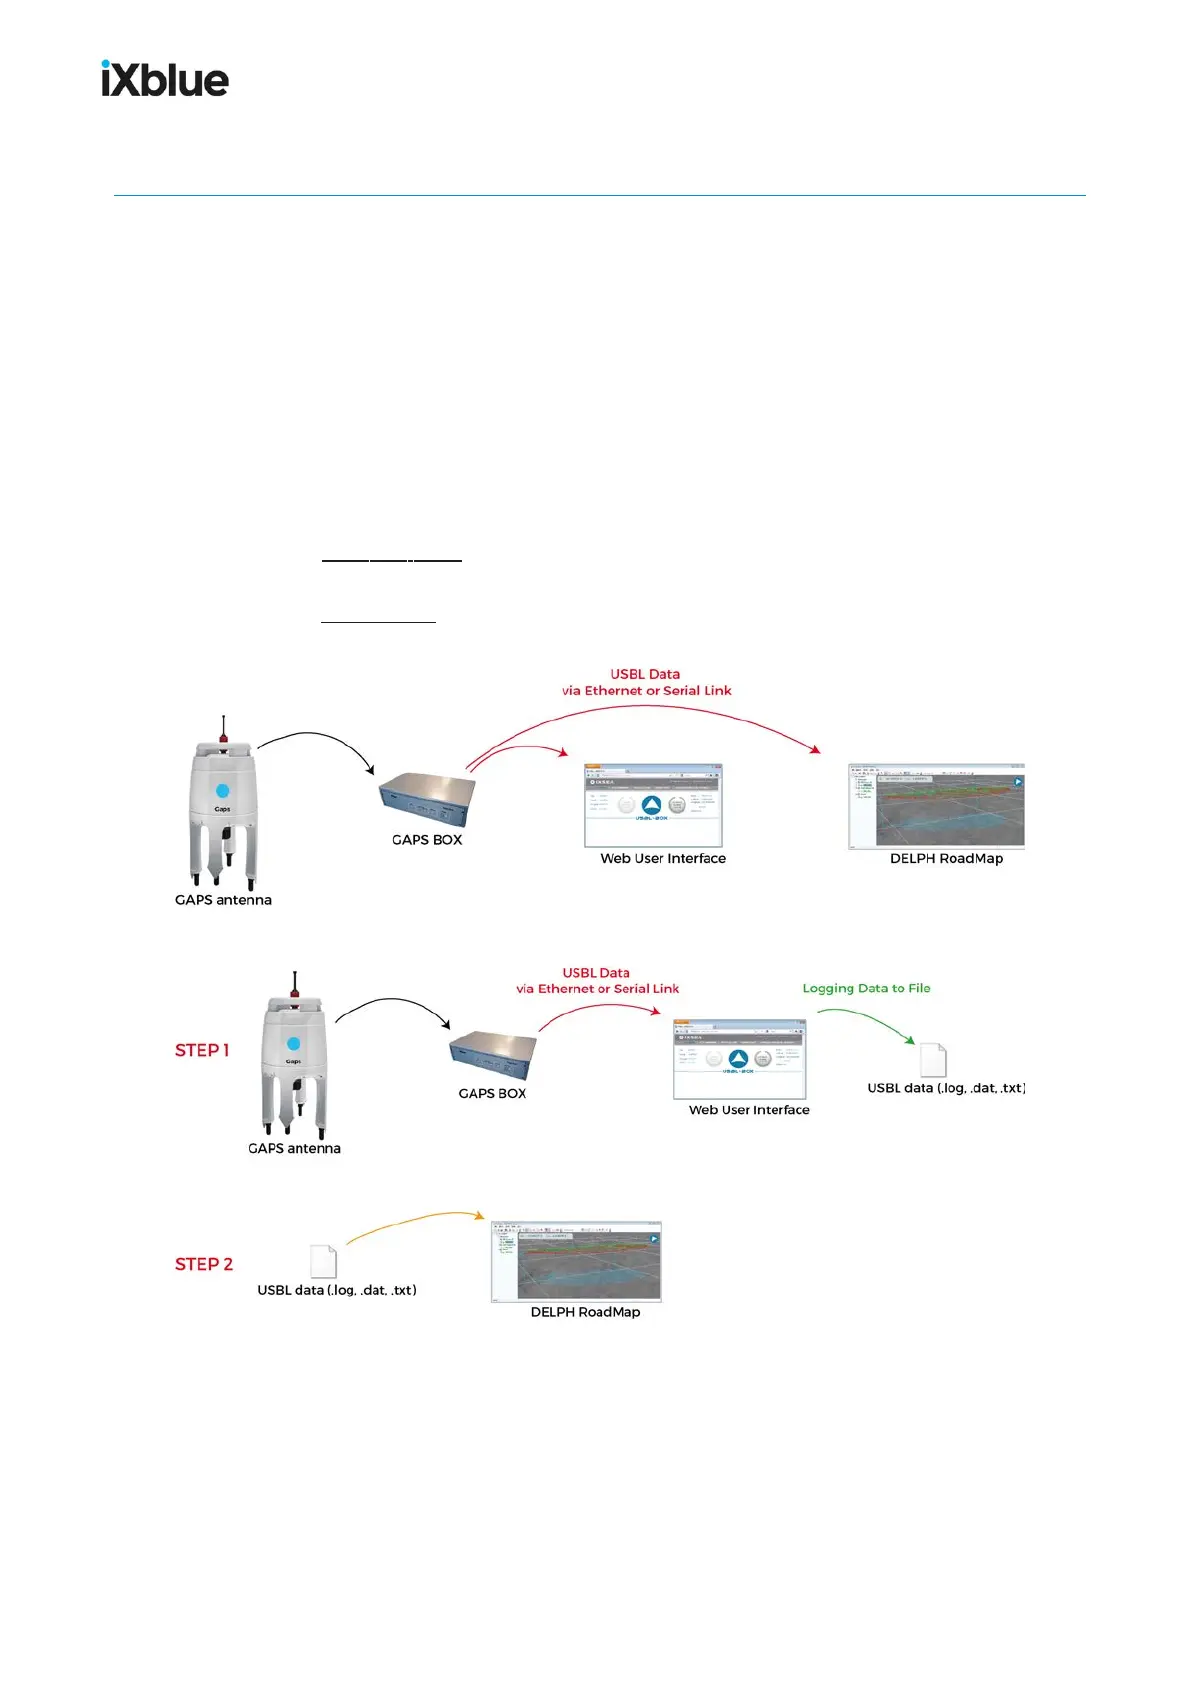
● Real-time mode: the real-time data is sent via the Ethernet or serial link, transmitted to
DELPH RoadMap and displayed in DELPH RoadMap main display area.
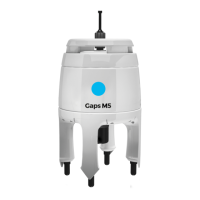
● Replay mode: the data is directly imported in DELPH RoadMap and all at once displayed
in the main graphic area.
Figure 38 - Visualization of USBL data in real-time mode
Figure 39 - Visualization of USBL data in off-line mode
92 MU-GAPS-AN-005-H - November 2019