GAPS - User Guide
9.3.5 FREQUENCY SPECTRUM OF THE HYDROPHONES
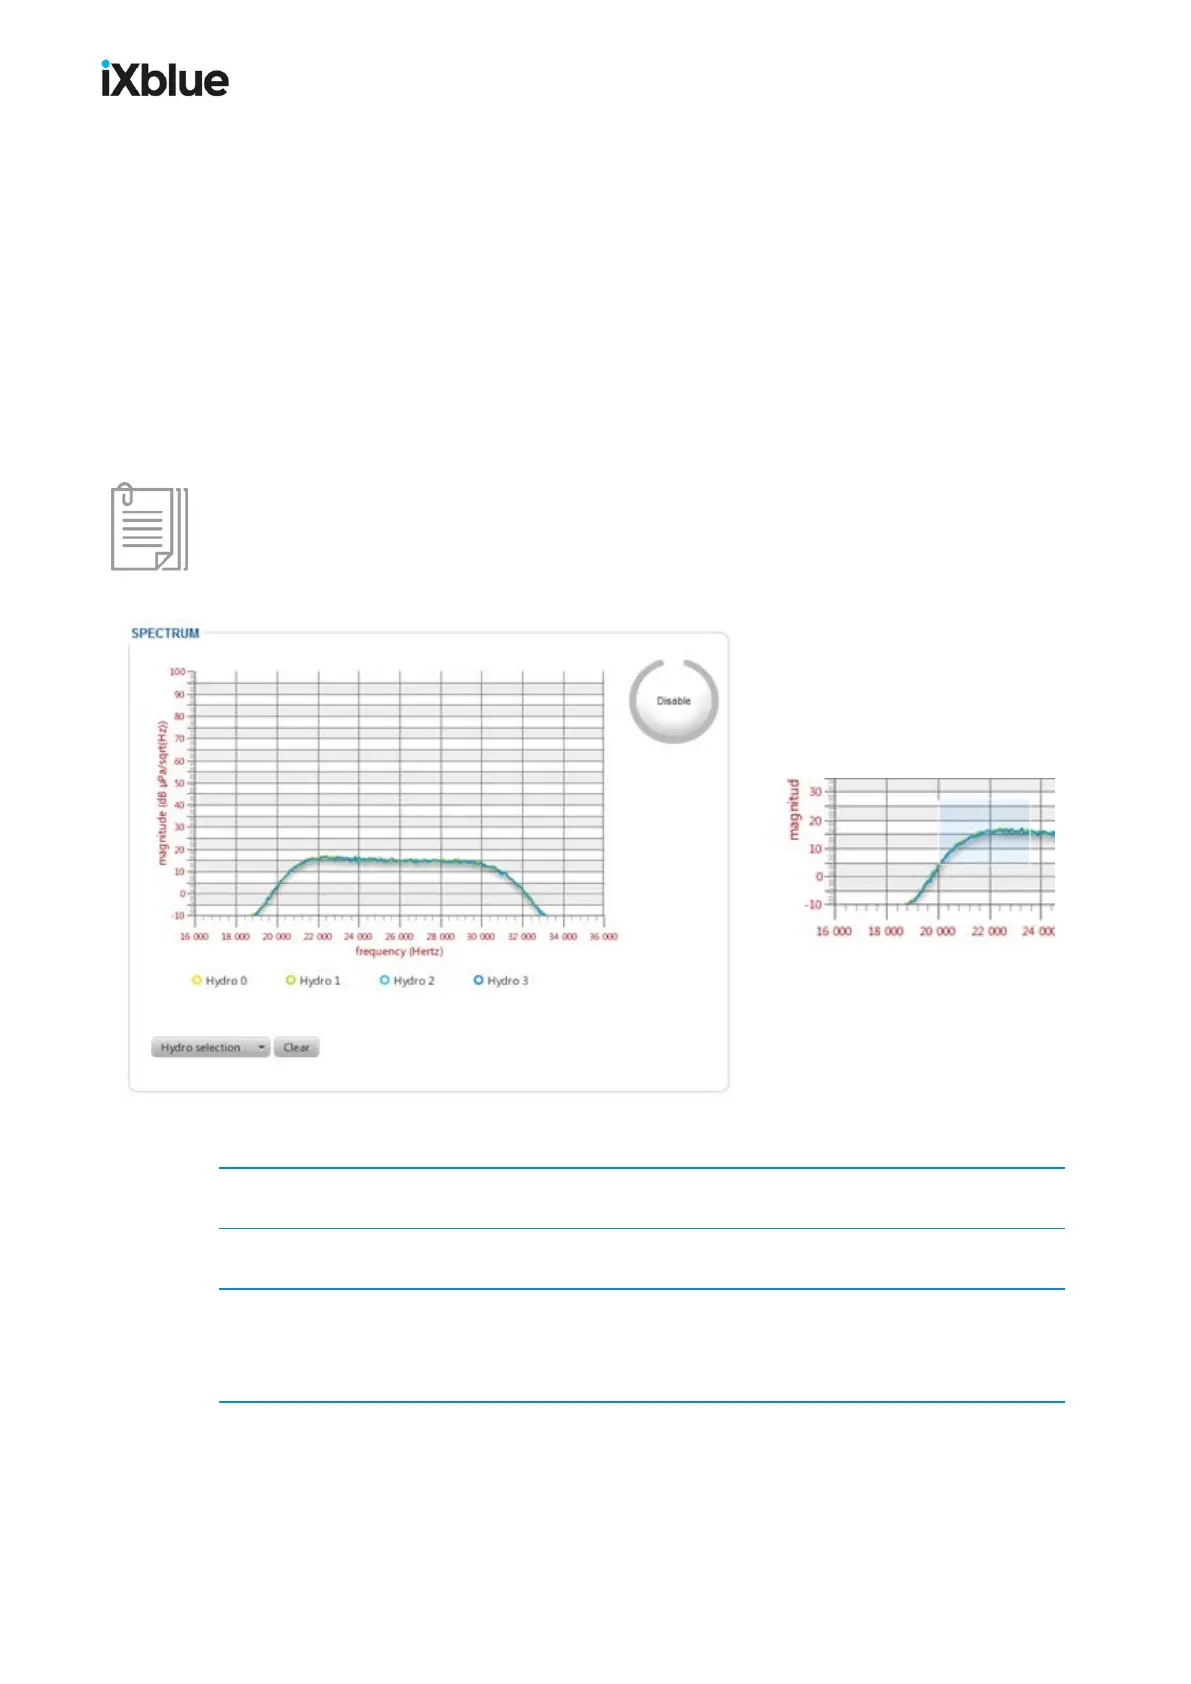
This tool helps the user to control the operating state of the four transponders. The control is
made via a frequency graph for each hydrophone. Such a display is shown below. For each
hydrophone you display the actual magnitude, the mean of the magnitude over time or the max
of this magnitude over time. This tool is available with the appropriate version of Java and of
the Web browser. Compatible versions are available in the release note.
Zoom
A few graphical tools are available from the mouse:
● Zoom on the graph with the scroll wheel of your mouse.
● Draw a zoom rectangle with left mouse button.
● Unzoom backto normal display with the right mouse button.
The range of the measurement is precise between 60 and 100 dB. Any noise measurement
outside this range may have degraded accuracy.
Figure 75 - SPECTRUM window and zoom effect
1. Select TOOLS > SPECTRUM.
2. Click on the Enable button.
3. Click on the Hydro selection button to select which hydrophone you want to display the
frequency spectrum. You may select Hydro x, Hydro mean x or Hydro max x.
The graph of the selected data is displayed.
MU-GAPS-AN-005-H - November 2019 151