Statistics 13 - 81
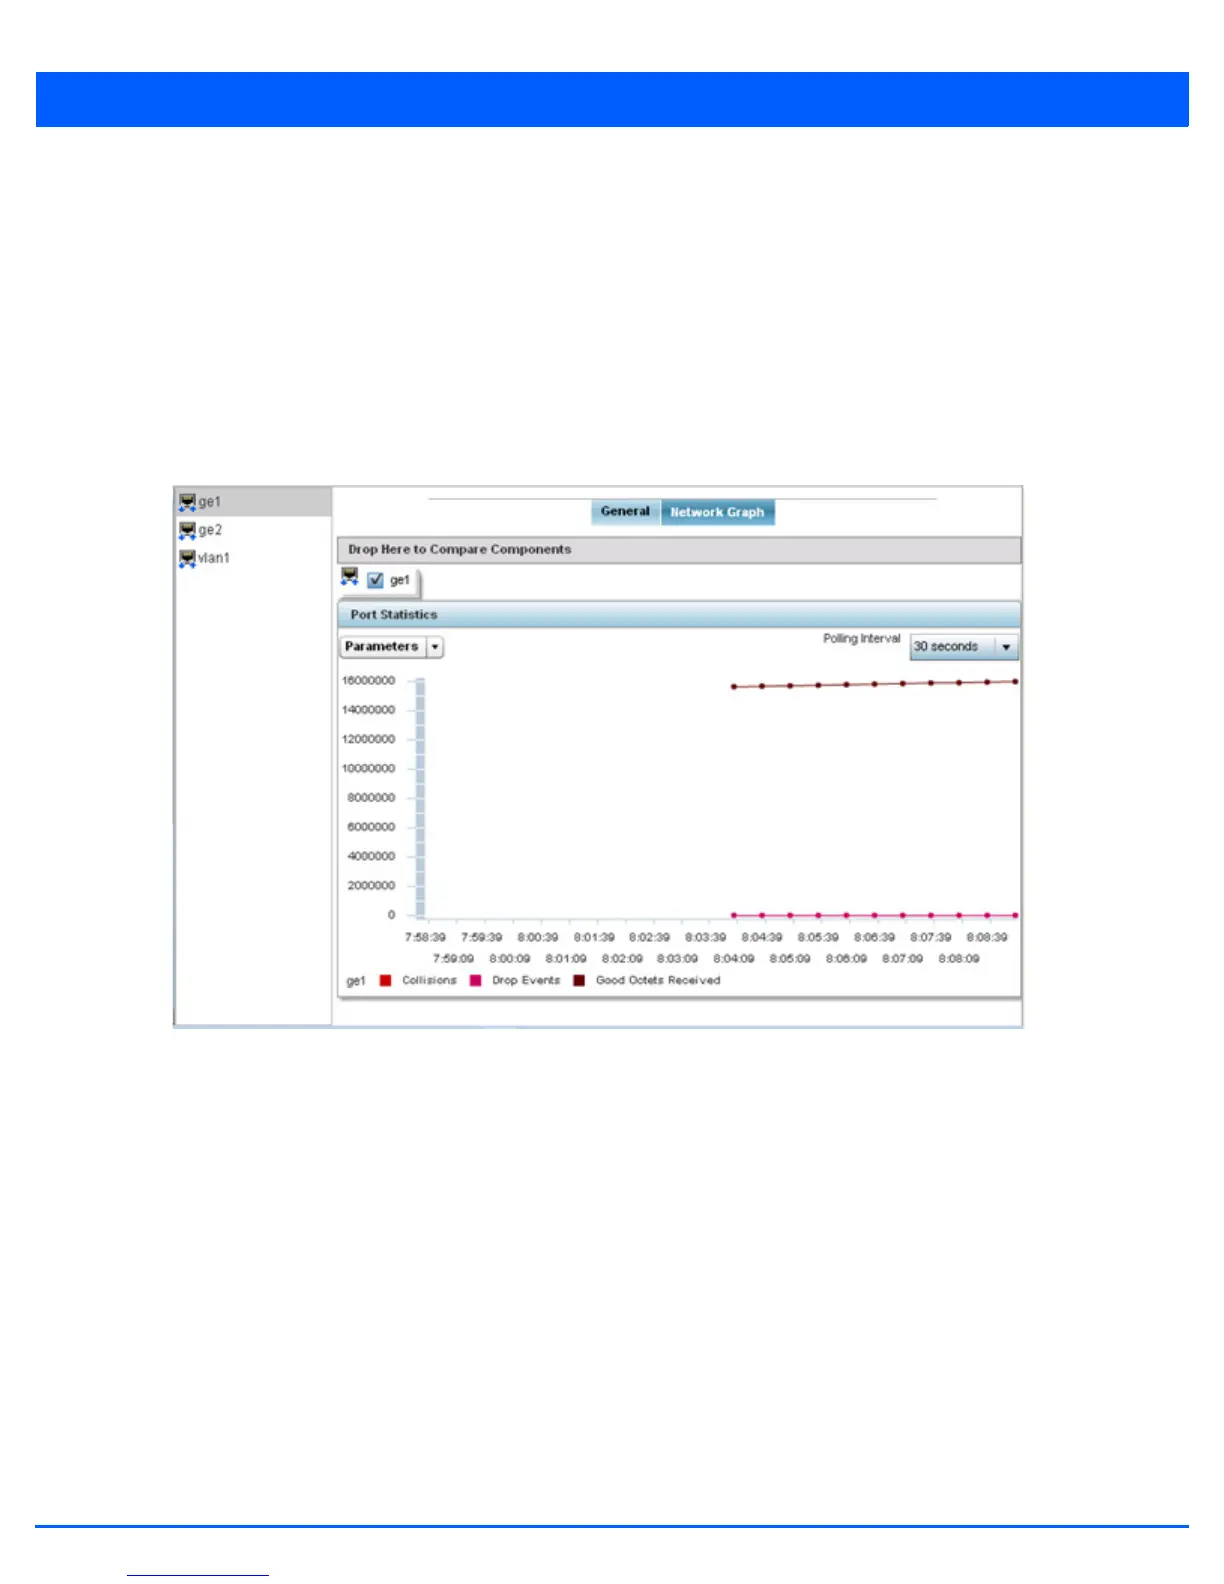
To view a detailed graph for an interface, select an interface and drop it on to the graph. The graph displays Port Statistics as
the Y-axis and the Polling Interval as the X-axis. Use the Polling Interval from-down menu to define the increment data is
displayed on the graph.
To view the Interface Statistics graph:
1. Select the Statistics menu from the Web UI.
2. Select System from the navigation pane (on the left-hand side of the screen). Expand a RF Domain and select one of its
connected access points.
3. Select Interfaces.
4. Select Network Graph.
Figure 13-49 Access Point- Interface Network Graph screen
13.3.12 RTLS
Access Point Statistics
The real time locationing system (RTLS) enables accurate location determination and presence detection capabilities for
Wi-Fi-based devices, Wi-Fi-based active RFID tags and passive RFID tags. While the operating system does not support
locationing locally, it does report the locationing statistics of both Aeroscout and Ekahau tags.
To review a selected access point’s RTLS statistics:
1. Select the Statistics menu from the Web UI.
2. Select System from the navigation pane (on the left-hand side of the screen). Expand a RF Domain and select one of its
connected access points.
3. Select RTLS.
 Loading...